The U.S. Treasury this morning reported a Federal Budget Deficit for the month of March 2018 of $208.74 billion, the largest ever deficit for the month of March in history. For the last two months, the U.S. has reported a total Federal Budget Deficit of $423.99 billion, its second largest deficit for any two month period in history. (The largest was February/March of 2012 when the U.S. reported a total Federal Budget Deficit of $429.83 billion.)
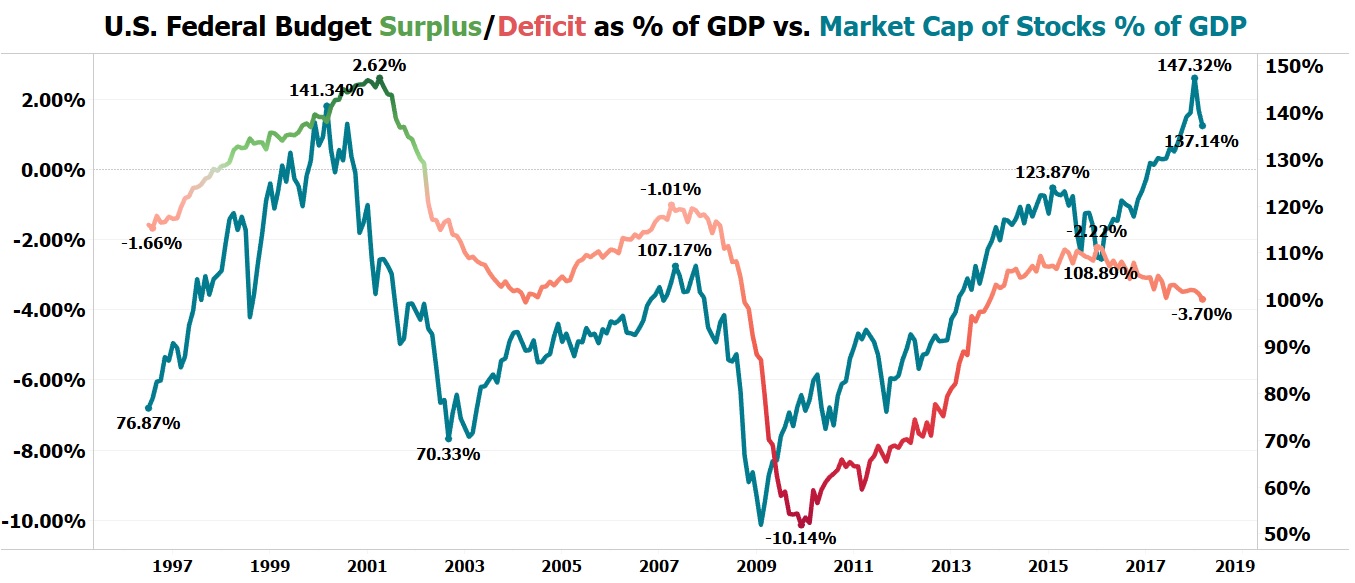
On a trailing twelve month basis, the U.S. has reported a total Federal Budget Deficit of $738.68 billion, equal to 3.7% of U.S. GDP. Historically, there has been a very close correlation between the market cap of U.S. stocks as a percentage of GDP and the Federal Budget Surplus/Deficit as a percentage of GDP. However, over the past three years, the U.S. market cap/GDP ratio has experienced a dramatic divergence from the Federal Budget Deficit/GDP ratio. Click here to see NIA's exclusive chart!
In August 2000 the last time the U.S. stock market was worth 137.14% of GDP like it is today, the U.S. had a budget surplus equal to 2.21% of GDP. In 2007 when the U.S. stock market peaked at 107.17% of GDP, the U.S. budget deficit declined to only 1.01% of GDP. For the U.S. Budget Deficit to be 3.7% of GDP with a Market Cap/GDP ratio of 137.14% is complete insanity!
The trailing 12 month U.S. Budget Deficit reached an eight-year low in January 2016 of $405.27 billion or 2.22% of GDP and has since increased by 82.27% to $738.68 billion or 3.7% of GDP, despite the Market Cap/GDP Ratio rising from 108.89% to 137.14% during this time period!
Preparing Americans for Hyperinflation