Most Bullish Chart in History
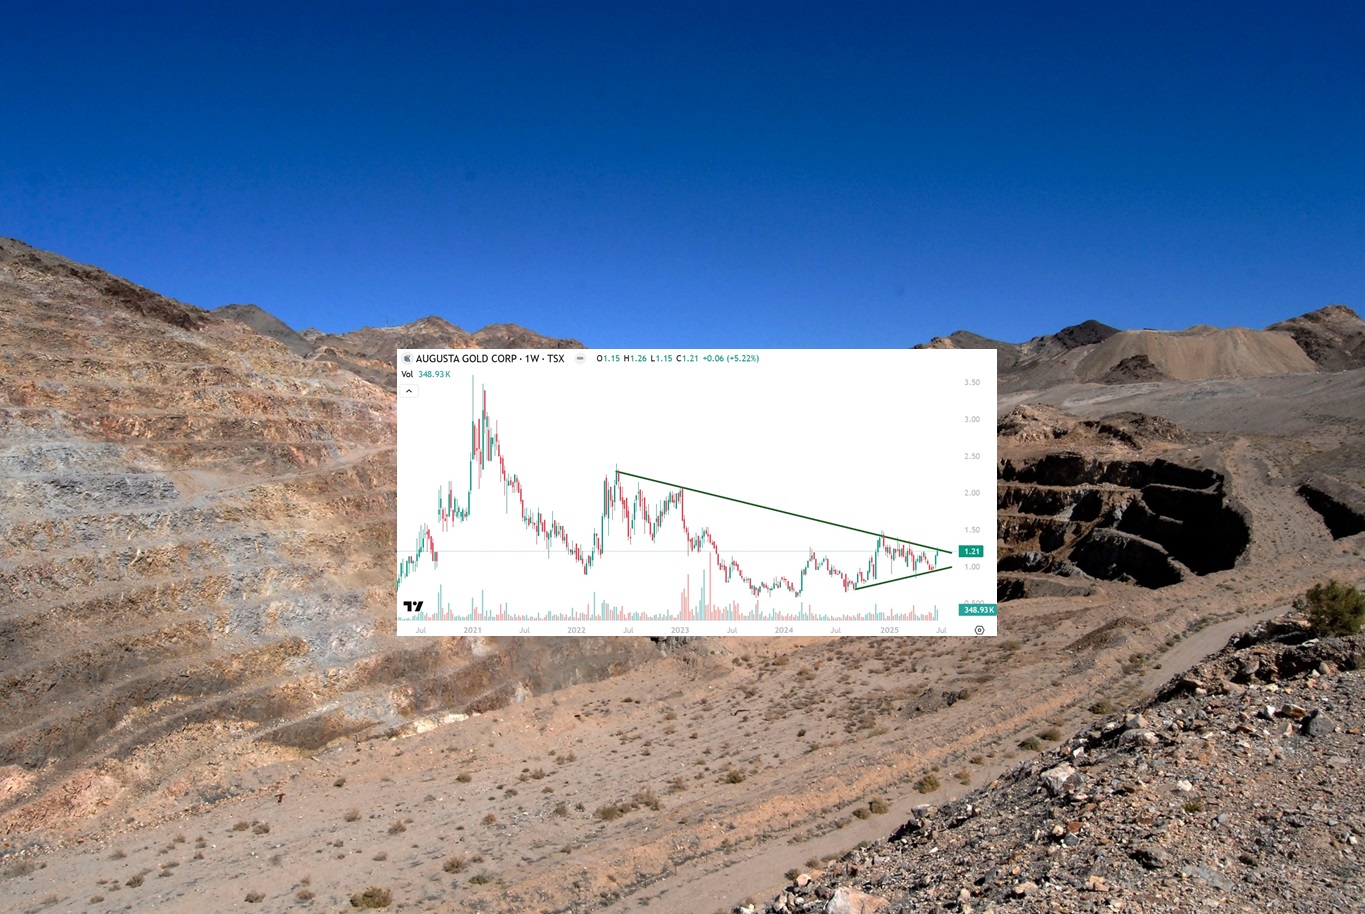
This following weekly chart of Augusta Gold (TSX: G) is the most bullish we have ever seen for any stock in history.

When Augusta Group initially invested in September 2020 at $1.20 their timing was wrong, but it still gapped up by 67% the following day and tripled to $3.60 in the following months despite a declining gold price.
When NIA first suggested it in April 2022 at $1.20 our timing was wrong, but it still doubled to $2.40 in the following months despite a declining gold price.
Today, the timing is finally right… and Augusta Gold (TSX: G) is about to become America's next gold producer.
Its move to $2.40 and then $3.60 will happen very rapidly.
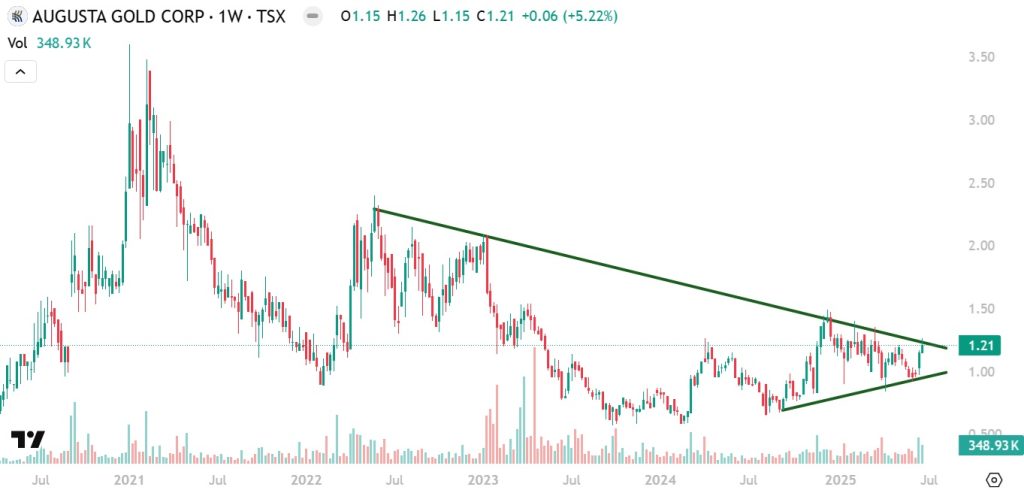
Past performance is not an indicator of future returns. NIA is not an investment advisor and does not provide investment advice. Always do your own research and make your own investment decisions. NIA’s President has purchased 232,200 shares of G and may purchase more shares. This message is meant for informational and educational purposes only and does not provide investment advice.