Heliostar Prefeasibility Study for Cerro del Gallo
Heliostar Announces Positive Prefeasibility Study for Cerro del Gallo with Significant Expansion Potential
Company Highlights
- Base Case: US$424M post-tax NPV5, 33.1% IRR, 2.3-year payback at US$2,300/oz gold.
- Upside Case: US$972M post-tax NPV5, 59.3% IRR, 1.4-year payback at US$3,900/oz gold.
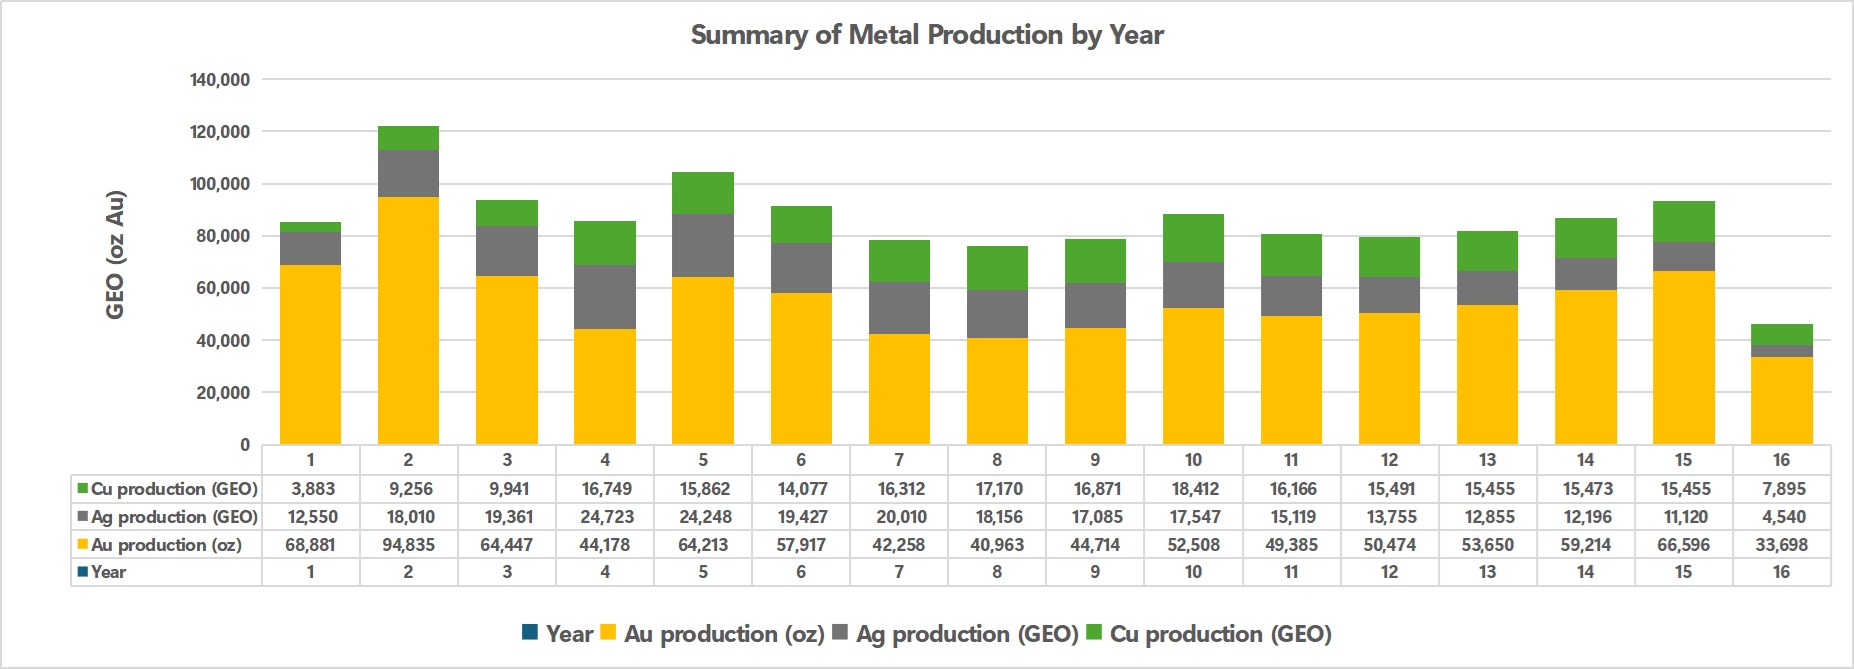
- Production: 1.31M GEOs over 15.3 years (~85,700 GEOs/yr; ~94,000 GEOs/yr in Years 1–5) at co-product AISC: US$1,390/GEO.
- Initial CAPEX: US$195.3M for an open-pit heap-leach mine + SART plant (incl. owner’s costs, contingency, working capital).
- FCF: Avg annual free cash flow US$47.6M (@$2,300/oz) / US$104.5M (@$3,900/oz).
- Resources: Indicated 240 Mt @ 0.63 g/t AuEq for 4.9M GEOs; Inferred 24 Mt @ 0.52 g/t AuEq for 0.4M GEOs.
Vancouver, British Columbia — Heliostar Metals Ltd. (OTCQX: HSTXF | FSE: RGG1) (“Heliostar” or the “Company”) announced updated Prefeasibility Study (“PFS”) results for its 100% owned Cerro del Gallo project in Guanajuato, Mexico.
Heliostar CEO Charles Funk commented that the PFS demonstrates a low-CAPEX project with strong cash flow at conservative gold prices and significant resource upside, and that the Company plans to continue technical work, permitting, and community engagement to advance the project toward feasibility.
Note: The supporting technical report is expected to be filed on SEDAR+ and posted to the Company website within ~45 days. All amounts are in US dollars unless noted.
Cerro del Gallo Prefeasibility Study Overview
The PFS is based on 2.27M GEOs of Probable Mineral Reserves (effective July 31, 2025). The mine plan contemplates a 15.3-year life, producing ~85.7 koz GEOs/year (LOM) at average total cash costs of $1,252/GEO and AISC of $1,390/GEO, with initial CAPEX of $195.3M.
The project is envisioned as a 6 Mtpa open-pit operation with conventional drill/blast/load/haul (contractor fleet). Ore will be crushed (including HPGR), stacked on a lined heap-leach pad, processed via ADR for gold doré, and copper/silver recovered via a SART circuit for shipment to smelters.
Key Highlights
Forecast Production Highlights
| Metric | Value | Units / Notes |
|---|---|---|
| Ore Feed | 6,000 | Ktpa |
| Strip Ratio | 0.32:1 | W:O |
| Grade (LOM) | 0.73 | g/t AuEq |
| Grade (Years 1–5) | 0.80 | g/t AuEq |
| Life of Mine Produced | 1,310 | Koz GEO |
| Processing Rate | 16,438 | Tpd |
| Process Recovery (Au / Ag / Cu) | 59.4 / 49.3 / 61.8 | % |
| Life of Mine | 15.3 | Years |
| Annual Production (LOM) | 85.7 | Koz GEO |
| Annual Production (Years 1–5) | 94.2 | Koz GEO |
Forecast Financial Highlights
| Metric | Value | Units |
|---|---|---|
| Average Cash Costs (per GEO) | $1,252 | US$/oz |
| Average AISC (per GEO) | $1,390 | US$/oz |
| Total Initial Capital Cost | $195.3 | US$M |
| Total Sustaining Capital Cost | $160.3 | US$M |
| Total LOM Capital Cost | $355.6 | US$M |
Notes: AISC is a non-IFRS measure (World Gold Council guidance). LOM capital includes US$132.0M reclamation at end of mine life.
Forecast Return Estimates (Gold Price Sensitivity Snapshot)
| Return Metric | US$2,300/oz (Base) | US$3,900/oz (Comparison) |
|---|---|---|
| IRR | 33.1% | 59.3% |
| NPV @ 5% discount | $423.9M | $972.4M |
| Payback | 2.3 years | 1.4 years |
All other key parameters set at base assumptions (including 5% discount rate). Returns are after tax.
Figures
Figure 1: Isometric View of Cerro del Gallo Resource with Reserve Pit Shell
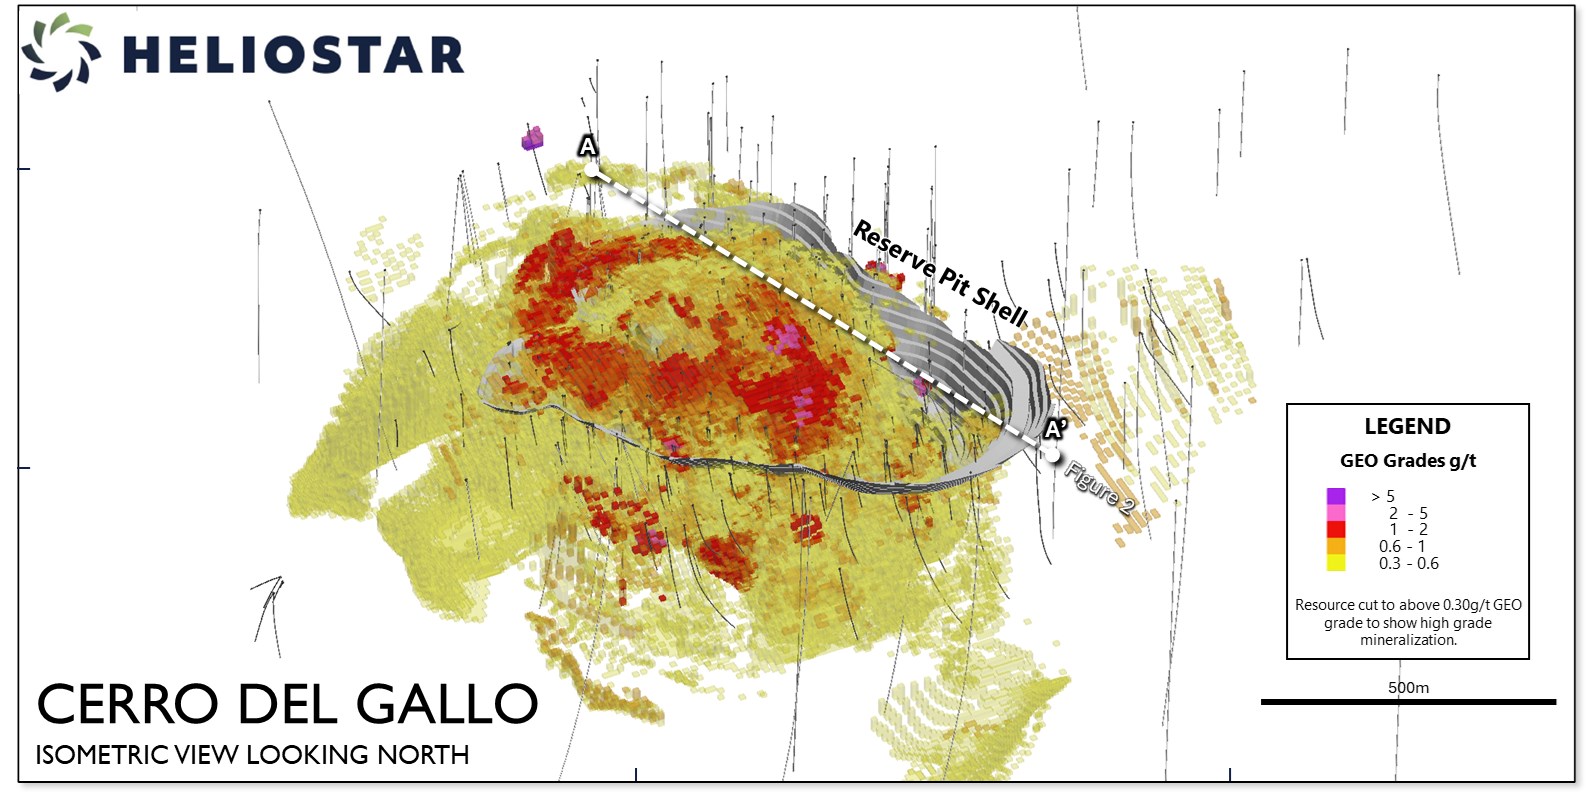
Figure 2: Cross Section through Cerro del Gallo Resource with Reserve Pit Shell

Figure 3: Planned Cerro del Gallo Site Layout
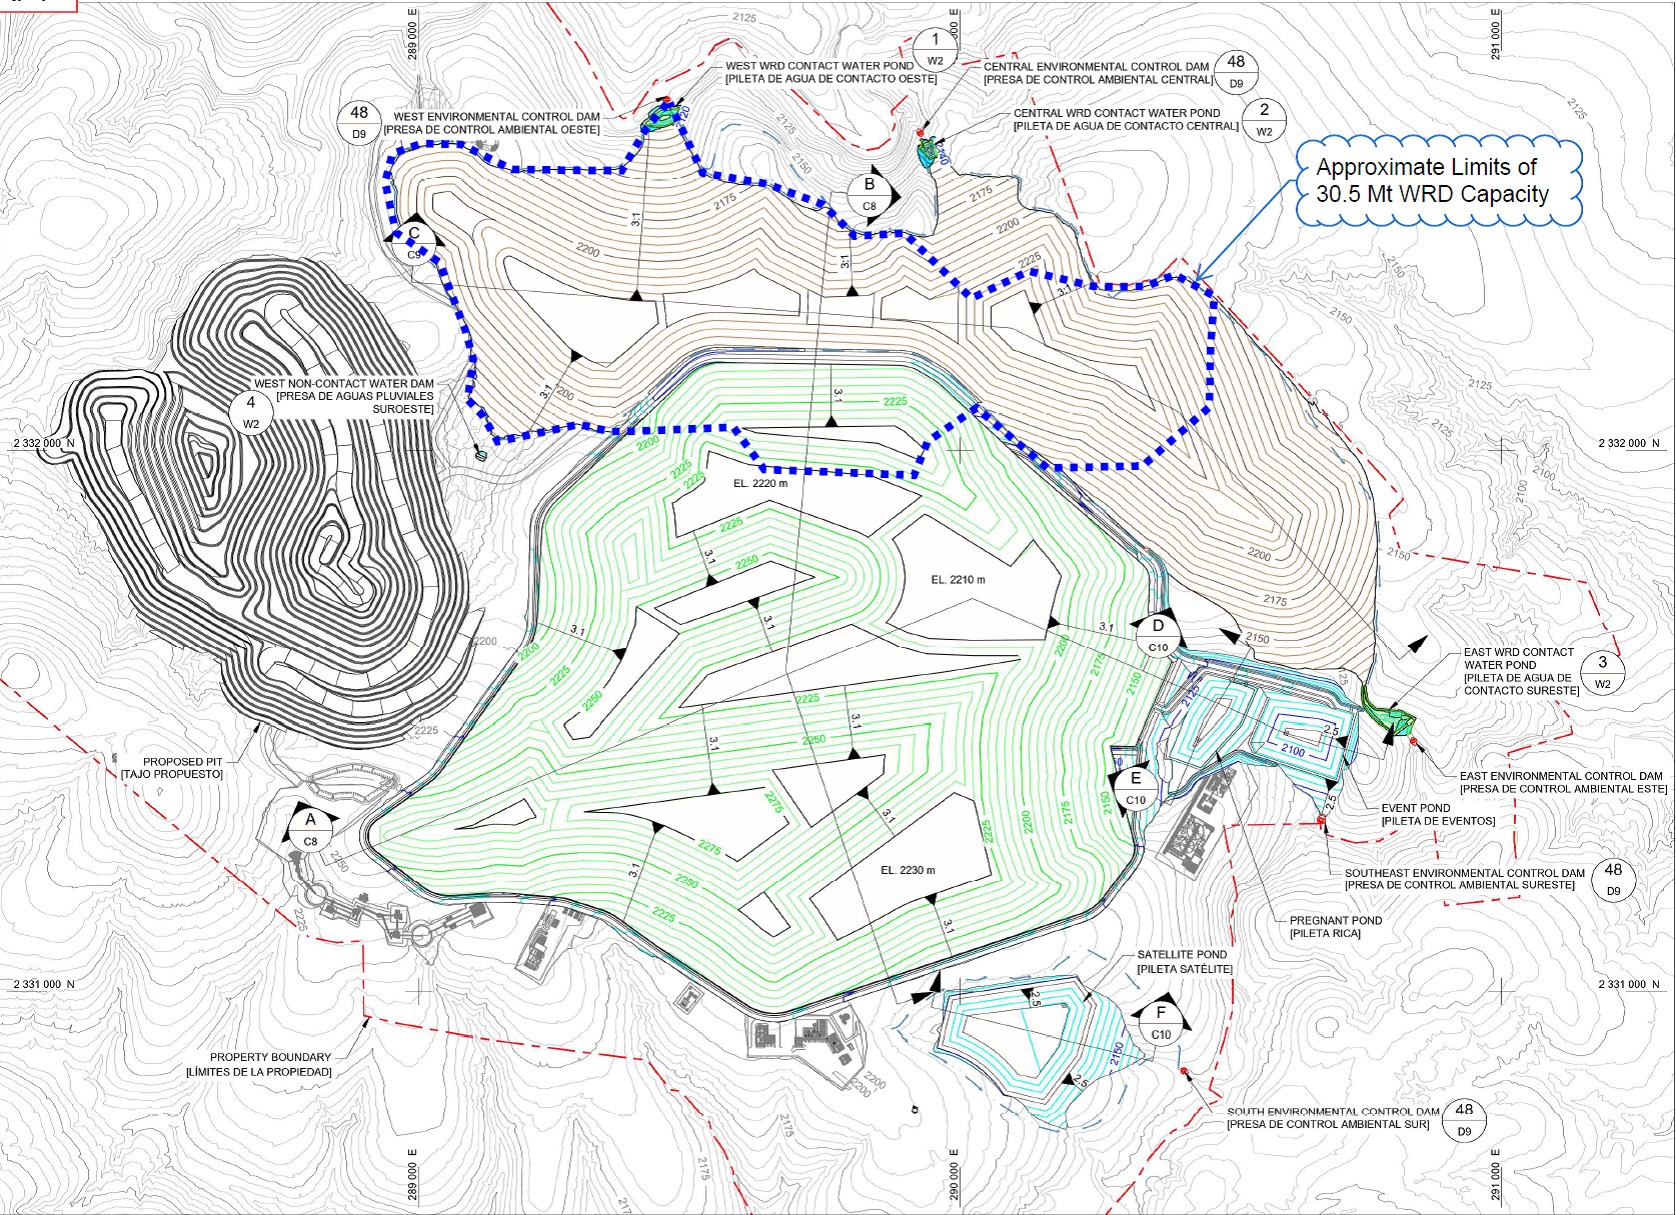
Figure 4: Cerro del Gallo Process Flow Sheet
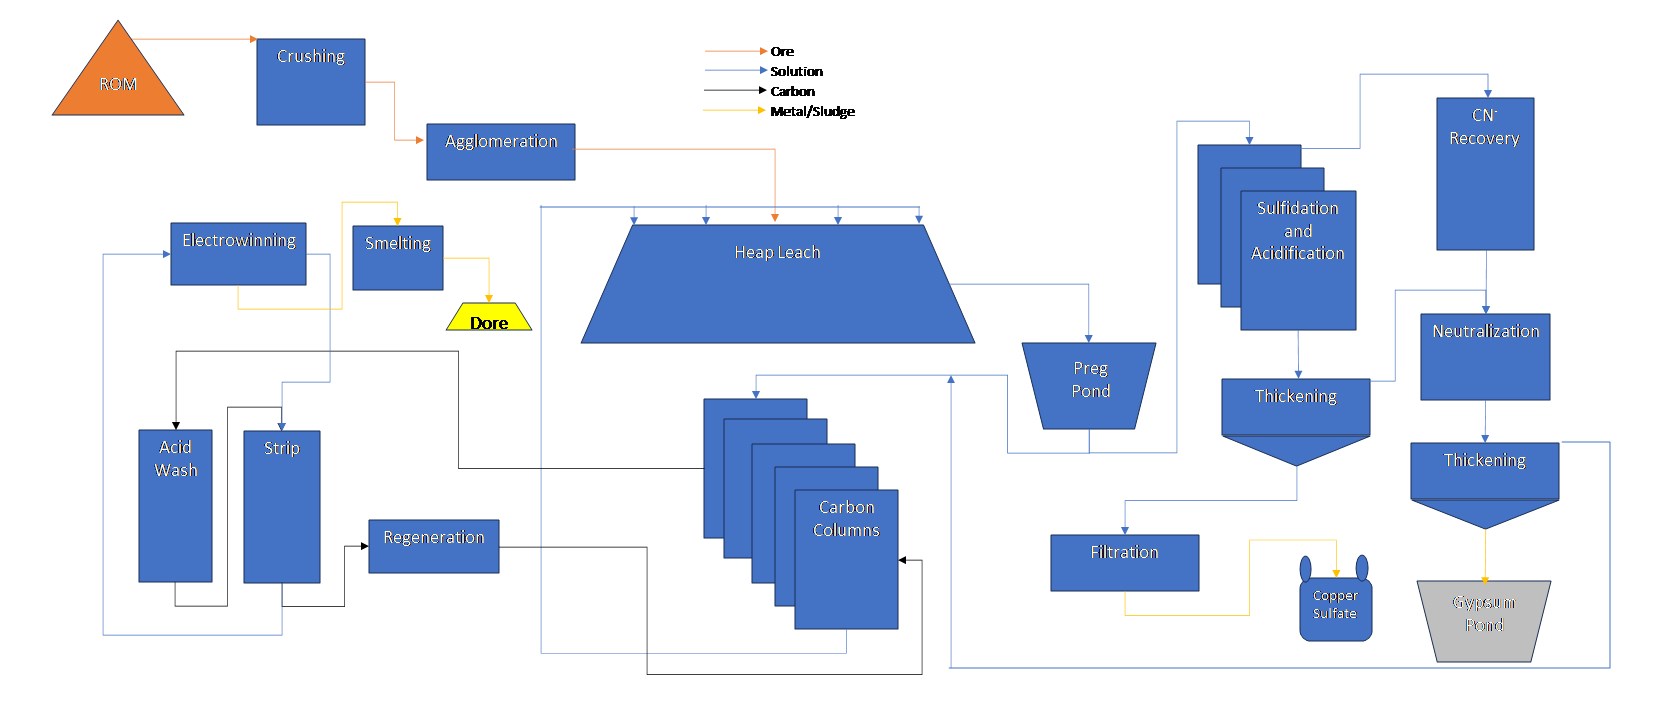
Figure 5: Cerro del Gallo Planned Production Schedule
Total Operating Cost Summary
| Operating Costs | Operating Cost (US$/GEO) | Operating Cost (US$/t ore) |
|---|---|---|
| Total mining | $274.02 | $3.79 |
| Total processing | $658.44 | $9.12 |
| Total site G&A | $65.61 | $0.91 |
| Smelter, refinery & transport | $68.55 | $0.95 |
| Cash operating costs | $1,066.62 | $14.77 |
| Production taxes | $80.29 | $1.11 |
| Royalties | $105.12 | $1.46 |
| Total cash costs | $1,252.03 | $17.33 |
| Sustaining capital costs | $138.2 | $1.91 |
| Total AISC | $1,390.23 | $19.25 |
Forecast Capital Cost Summary
| Capital Costs | Initial (US$M) | Sustaining (US$M) | Total LOM (US$M) |
|---|---|---|---|
| Mining Costs | $1.4 | – | $1.4 |
| Mobile Equipment | $3.9 | – | $3.9 |
| Site & Utilities General | $10.2 | – | $10.2 |
| Power Generation & Site Distribution | $11.0 | – | $11.0 |
| Crushing Circuit | $28.8 | – | $28.8 |
| Agglomeration | $4.9 | – | $4.9 |
| Stacking System | $6.8 | – | $6.8 |
| Heap Leach Solution | $21.1 | – | $21.1 |
| SART Plant | $20.3 | – | $20.3 |
| Recovery Plant | $13.3 | $35.1 | $48.4 |
| Reagents | $2.5 | – | $2.5 |
| Laboratory | $2.9 | – | $2.9 |
| Total direct costs | $127.2 | $35.1 | $162.3 |
| Spare Parts | $5.7 | – | $5.7 |
| Initial Fills | $0.9 | – | $0.9 |
| Contingency | $22.1 | $8.8 | $30.9 |
| Indirect Costs | $6.5 | – | $6.5 |
| Other Owner’s Costs | $3.6 | – | $3.6 |
| EPCM | $13.8 | – | $13.8 |
| Working Capital (60 days) | $15.6 | -$15.6 | – |
| Closure and reclamation | – | $132.0 | $132.0 |
| Total indirect costs | $68.2 | $125.2 | $193.4 |
| Total Costs (excluding IVA) | $195.3 | $160.3 | $355.6 |
Summary Economic Results
| Project Valuation Overview | Units | After Tax | Before Tax |
|---|---|---|---|
| Total cash flow | US$ M | $724.1 | $1,166.9 |
| Average annual cash flow | US$ M | $47.6 | $76.3 |
| Average annual cash flow (Years 1–5) | US$ M | $77.6 | $104.7 |
| NPV @ 5.0% (base case) | US$ M | $423.9 | $699.4 |
| Internal rate of return | % | 33.1% | 44.9% |
| Payback period | Years | 2.3 | 1.8 |
| Payback multiple | x | 4.4 | 6.5 |
Gold Price Sensitivity Analysis
| Gold Price (US$/oz) | Net Cash Flow (US$M) | After-Tax NPV @ 5% (US$M) | IRR (%) | Payback (years) | Payback Multiple |
|---|---|---|---|---|---|
| 900 | -$43.38 | -$60.62 | – | 9.5 | 0.8 |
| 1,100 | $66.08 | $9.89 | 6.1% | 5.6 | 1.3 |
| 1,300 | $176.64 | $79.94 | 12.4% | 3.9 | 1.8 |
| 1,500 | $286.0 | $148.8 | 17.3% | 3.1 | 2.3 |
| 1,700 | $395.4 | $217.6 | 21.6% | 3.5 | 2.8 |
| 1,900 | $505.3 | $286.8 | 25.7% | 2.9 | 3.4 |
| 2,100 | $614.7 | $355.4 | 29.5% | 2.6 | 3.9 |
| 2,300 | $724.1 | $423.9 | 33.1% | 2.3 | 4.4 |
| 2,500 | $833.5 | $492.5 | 36.7% | 2.0 | 4.9 |
| 2,700 | $942.8 | $561.0 | 40.1% | 1.9 | 5.4 |
| 2,900 | $1,052.2 | $629.6 | 43.5% | 1.8 | 5.9 |
| 3,100 | $1,161.6 | $698.2 | 46.8% | 1.7 | 6.4 |
| 3,300 | $1,270.9 | $766.7 | 50.0% | 1.6 | 6.9 |
| 3,500 | $1,380.3 | $835.3 | 53.2% | 1.5 | 7.4 |
| 3,700 | $1,489.66 | $903.85 | 56.3% | 1.4 | 7.9 |
| 3,900 | $1,599.03 | $972.41 | 59.3% | 1.4 | 8.5 |
| 4,100 | $1,708.40 | $1,040.97 | 62.3% | 1.3 | 9.0 |
Mineral Resources Statement (Effective July 31, 2025)
| Classification | Material Type | NSR Cutoff | Tonnes (kt) | Au (g/t) | Ag (g/t) | Cu (%) | AuEq (g/t) | Gold (koz) | Silver (koz) | Copper (t) | AuEq (koz) |
|---|---|---|---|---|---|---|---|---|---|---|---|
| Indicated | Oxide | $11.81 | 10,733 | 0.41 | 17.92 | 0.09 | 0.60 | 141 | 6,184 | 9,659 | 207 |
| Indicated | Mix Oxide | $10.66 | 13,613 | 0.28 | 11.12 | 0.08 | 0.50 | 123 | 4,867 | 10,890 | 219 |
| Indicated | Mix Sulfide | $11.81 | 70,066 | 0.40 | 13.70 | 0.09 | 0.68 | 901 | 30,862 | 63,060 | 1,532 |
| Indicated | Sulfide | $11.23 | 145,572 | 0.38 | 13.77 | 0.11 | 0.62 | 1,778 | 64,447 | 160,129 | 2,902 |
| Total | 239,984 | 0.38 | 13.78 | 0.10 | 0.63 | 2,944 | 106,359 | 243,739 | 4,859 | ||
| Inferred | Oxide | $11.81 | 2,042 | 0.19 | 21.08 | 0.09 | 0.40 | 12 | 1,384 | 1,838 | 26 |
| Inferred | Mix Oxide | $10.66 | 1,604 | 0.14 | 16.12 | 0.07 | 0.40 | 7 | 831 | 1,123 | 21 |
| Inferred | Mix Sulfide | $11.81 | 10,501 | 0.28 | 13.75 | 0.11 | 0.57 | 95 | 4,642 | 11,552 | 192 |
| Inferred | Sulfide | $11.23 | 10,300 | 0.33 | 11.74 | 0.07 | 0.51 | 109 | 3,888 | 7,210 | 169 |
| Total | 24,448 | 0.28 | 13.67 | 0.09 | 0.52 | 224 | 10,746 | 21,722 | 408 |
Mineral Reserves Statement (Effective July 31, 2025)
| Classification | Material Type | Tonnes (kt) | Au (g/t) | Ag (g/t) | Cu (%) | AuEq (g/t) | Gold (koz) | Silver (koz) | Copper (t) | AuEq (koz) |
|---|---|---|---|---|---|---|---|---|---|---|
| Probable | Oxide | 9,198 | 0.46 | 18.46 | 0.08 | 0.65 | 137 | 5,459 | 7,714 | 193 |
| Probable | Mix Oxide | 4,411 | 0.42 | 10.74 | 0.09 | 0.64 | 59 | 1,524 | 4,115 | 91 |
| Probable | Mix Sulfide | 38,761 | 0.50 | 15.26 | 0.10 | 0.80 | 629 | 19,020 | 37,354 | 995 |
| Probable | Sulfide | 39,524 | 0.53 | 15.00 | 0.12 | 0.78 | 670 | 19,064 | 45,557 | 997 |
| Total | 91,893 | 0.51 | 15.25 | 0.10 | 0.77 | 1,495 | 45,066 | 94,740 | 2,275 |
Important Disclosures
Past performance is not an indicator of future returns. NIA is not an investment advisor and does not provide investment advice. Always do your own research and make your own investment decisions.
Compensation disclosure: NIA has received compensation from HSTR of US$30,000 cash for a three-month marketing contract and previously received US$30,000 cash for a three-month marketing contract which has since expired.
This message is meant for informational and educational purposes only and does not provide investment advice.