Panic Selling Incoming? Why This TSXV Pullback Changes Nothing (Mirroring the 2002–2007 Bull Market Almost Exactly)
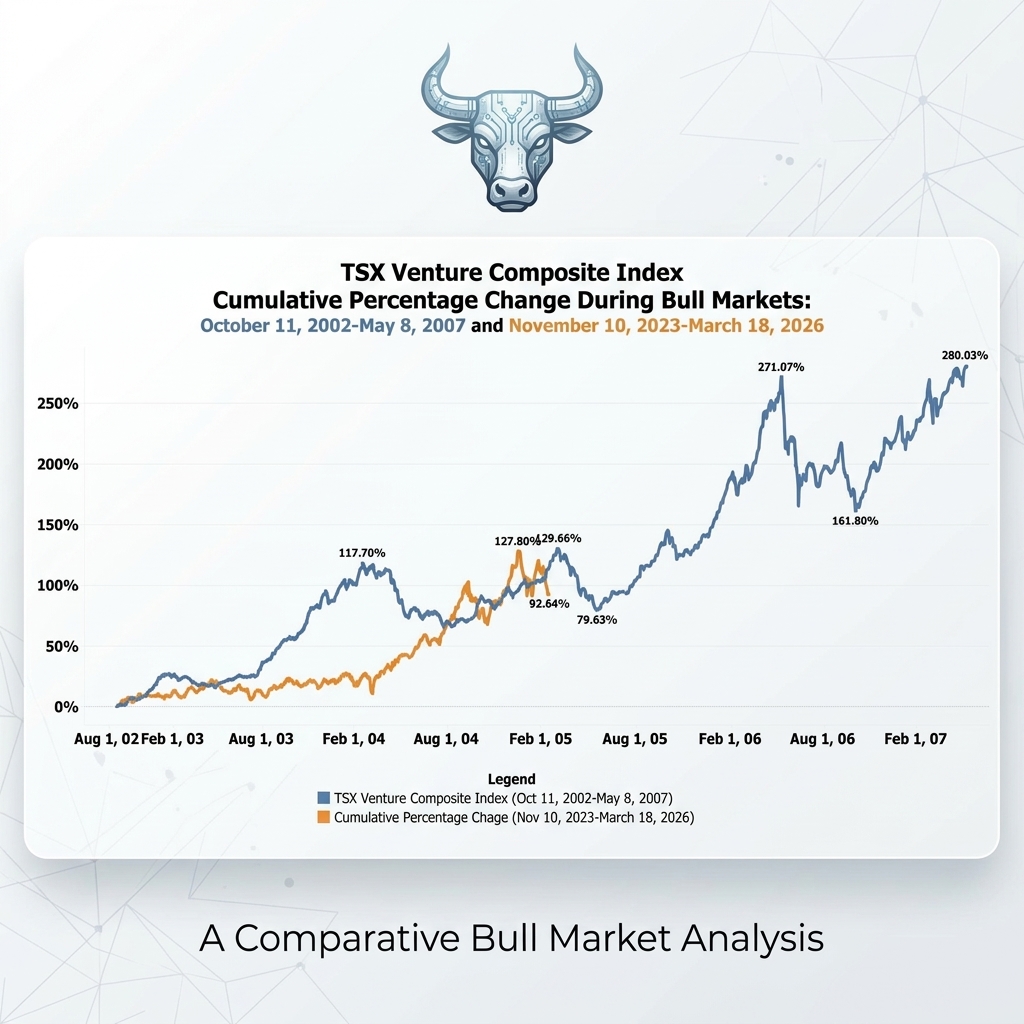
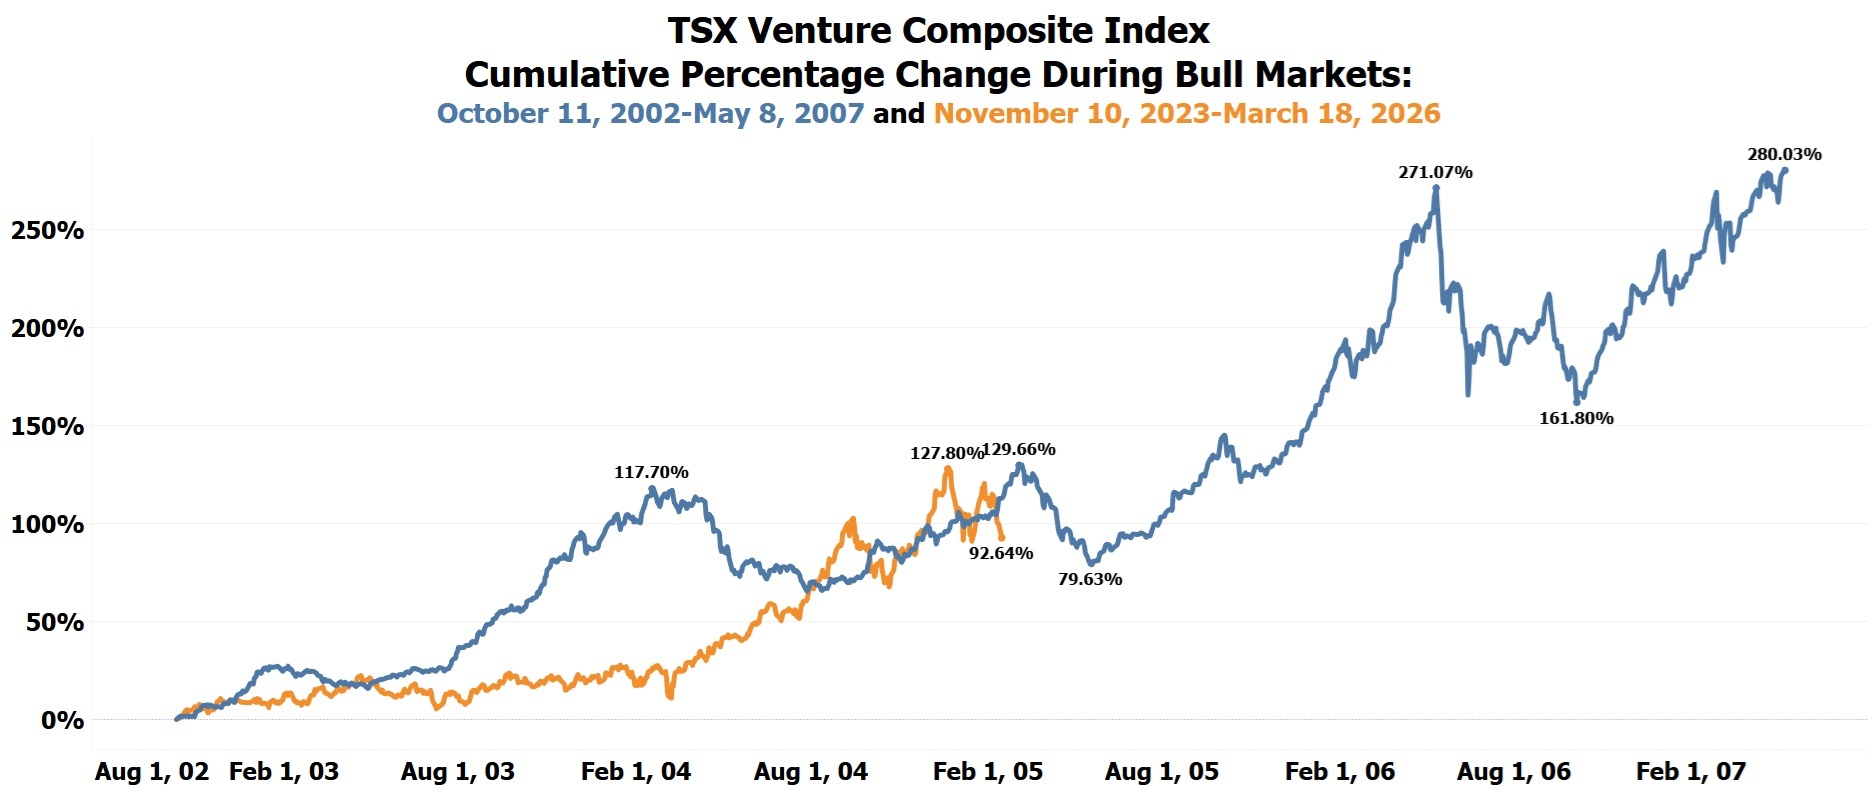
We created a chart comparing the cumulative percentage gain of the TSX Venture Composite Index during the 2002–2007 bull market with the current cycle beginning from the November 2023 low through today.
The key difference is in sentiment and early momentum. This bull market was widely doubted in its early stages, advancing slowly on low volume before more recently accelerating and playing catch-up.
One major similarity is that both cycles reached an initial short-term peak at nearly identical levels. The current bull market peaked after a 127.80% gain over 553 days, compared to a 129.66% gain over 605 days in the previous bull market.
The TSX Venture Composite Index declined by 3.47% today to 976.02, bringing it almost exactly back to where it stood on October 23rd, when NIA predicted a six-month period of sideways consolidation at approximately 964.
Looking ahead, we expect potential short-term volatility driven by profit-taking. Many investors who bought gold/silver stocks near the November 2023 lows may feel pressure to lock in profits, fearing a deeper pullback. However, a return to those prior lows remains highly unlikely.
Importantly, there are already many high-quality bargains emerging at attractive valuations. Based on the prior bull market, where a bottom occurred near the ~79.63% cumulative gain level, it is possible the TSX Venture Composite Index could temporarily decline toward ~910 before resuming its broader upward rally.