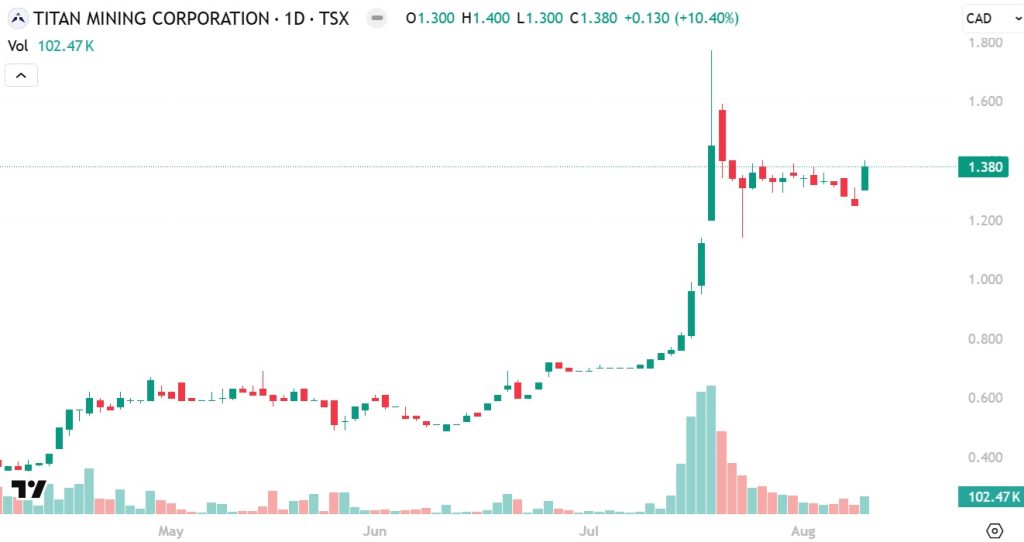
Titan Mining (TSX: TI) Gains by 10.40% to $1.38 and Will Surpass Hydrograph Clean Power (CSE: HG) in Market Cap Before Year-End
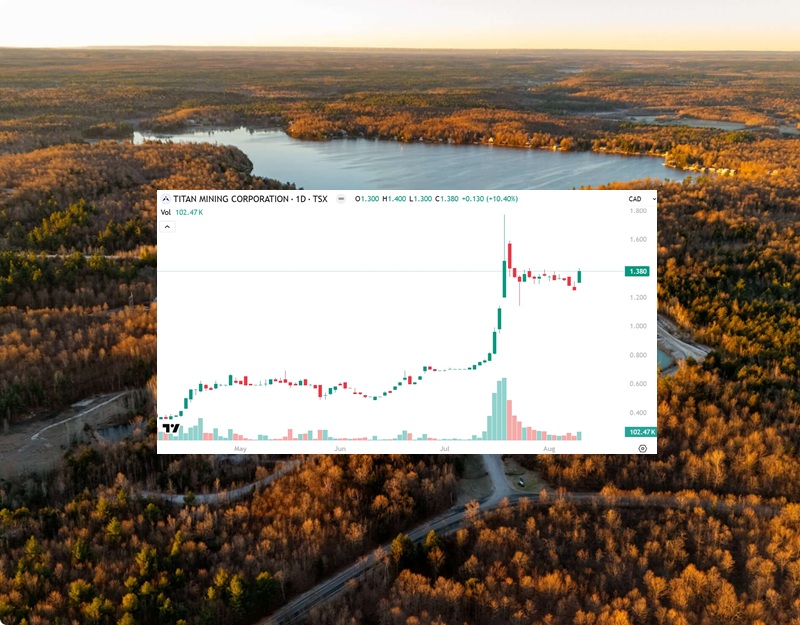
Titan Mining (TSX: TI) gained by 10.40% today to $1.38 per share and has so far gained by 146.43% since NIA's April 17th suggestion at $0.56 per share. Titan's market cap will be significantly higher than Hydrograph Clean Power (CSE: HG) before year-end.
Titan Mining Delivers Strong Q2 Results; On Track to Commission First Integrated U.S. Graphite Facility in 2025
GOUVERNEUR, N.Y. and VANCOUVER, British Columbia, Aug. 12, 2025 (GLOBE NEWSWIRE) — Titan Mining Corporation (TSX: TI; OTCQB: TIMCF) ("Titan" or the "Company") today announced its financial and operating results for the quarter ended June 30, 2025. The Company met quarterly production guidance at its Empire State Mines LLC (“ESM”) and is on track to be the first end to end producer of natural flake graphite in the United States by Q4 2025.
Q2 25 HIGHLIGHTS:(1)
- Payable zinc production of 15.5 million pounds, up 7% from Q2 2024
- Revenues of $16.3 million, C1 cash costs and AISC of $0.90/lb
- Cash flow from operations of $2.4 million
- Reduction in net debt by 21% from Q2 2024
- Cash balance of $8.1 million at quarter end
- EXIM Bank financing secured for $15.8 million, the first direct mining loan under its Make More in America Initiative (2)
- Strong safety performance, with an injury frequency rate well below the U.S. national average
- Over 40,000 acres of mineral rights added through lease and option to lease agreements with St. Lawrence County in May 2025. This expands the Company’s mineral tenure to over 120,000 acres in upstate New York and increases the discovery opportunities for additional zinc and graphite resources as well as iron-oxide copper gold deposits
- Graphite processing facility construction underway at ESM site; over 50% of major equipment delivered
- Expected commissioning in Q4 2025, making Titan the first integrated producer of natural flake graphite in the U.S. in over 70 years.
(1) All amounts disclosed in this news release are in U.S. dollars unless otherwise stated.
(2) The EXIM Bank Financing was completed on July 21, 2025, subsequent to end of Q2 2025.
Don Taylor, Chief Executive Officer of Titan, commented, “Our Q2 performance reflects consistent execution at ESM, with strong production, start-up of the N2D zone and continued cost control. Importantly, our graphite project has moved from concept to construction, supported by public and private sector backing. Titan is building the foundation to become a multi-commodity, integrated supplier of critical minerals to the U.S. economy”.
Rita Adiani, President of Titan commented: “Titan is executing a unique dual-commodity strategy. Our zinc operations continue to generate cash flow, while the Kilbourne graphite first phase processing facility is rapidly progressing toward commissioning. With strong government support and tangible progress on-site, we’re positioning Titan as a future-facing, U.S.-based supplier of both industrial and critical minerals”.
TABLE 1 Financial and Operating Highlights
| 2025 | ||||
| Q2 | Q1 | YTD | ||
| Operating | ||||
| Payable zinc produced | mlbs | 15.51 | 15.37 | 30.88 |
| Payable zinc sold | mlbs | 16.04 | 15.57 | 31.61 |
| Average Realized Zinc Price | $/lb | 1.20 | 1.29 | 1.24 |
| C1 Cost(1) | $/lb | 0.90 | 0.91 | 0.91 |
| AISC(1) | $/lb | 0.90 | 0.96 | 0.93 |
| Financial | ||||
| Revenue | $m | 16.34 | 16.02 | 32.36 |
| Net Income (loss) after tax | $m | 0.54 | 0.35 | 0.89 |
| Earnings (loss) per share- basic | $/sh | 0.00 | 0.00 | 0.01 |
| Cash Flow from Operating Activities before changes in non-cash working capital | $m | 2.36 | 2.69 | 5.05 |
| Financial Position | ||||
| Cash & Cash Equivalents | $m | 8.1 | 12.2 | 8.1 |
| Net Debt(1) | $m | 24.2 | 23.1 | 24.2 |
Note: The sum of the quarters in the table above may not equal the year-to-date amounts disclosed elsewhere due to rounding.
1 C1 Cash Cost, All-In Sustaining Cost (“AISC”) and Net Debt are non-GAAP measures. Accordingly, these financial measures are not standardized financial measures under IFRS and might not be comparable to similar financial measures disclosed by other issuers. These financial measures have been calculated on a basis consistent with historical periods. Information explaining these non-GAAP measures is provided below under “Non-GAAP Performance Measures”.
ZINC OPERATIONS REVIEW
Mining during the quarter continued in the Mahler, New Fold, and Mud Pond zones at the #4 mine, with additional production initiated from the N2D zone for the first time since May 2023. High-grade ore from the Lower Mahler zone supported above-budget output. N2D production is ramping from 250 to 500 tons per day in Q3.
GRAPHITE UPDATE
Construction of the Kilbourne graphite demonstration plant is advancing, with over half of major equipment being delivered and site installation underway. Commissioning is on track for Q4 2025. Once operational, the facility will be the first to produce natural flake graphite end-to-end in the U.S. in over 70 years. Technical studies for the project are underway.
EXPLORATION UPDATE
The Company added additional 43,942 acres of mineral rights added through lease and option to lease agreements with St. Lawrence County in May of 2025 (See press release dated May 8th, 2025 “Titan Mining Signs Cooperative Agreements with St. Lawrence County, Expands Mineral Tenure to Greater Than 120,000 acres in Upstate New York”). Titan continues to evaluate the potential of the district for base, industrial, and precious metals. Multiple areas with historically documented graphite mineralization have been identified, with confirmed graphite mineralization within the ESM mineral tenure. The St. Lawrence County agreement has added the Parish Magnetite prospect to the Company’s target list, a possible Iron Oxide Copper Gold (IOCG) occurrence in the historic Adirondack Magnetite Belt.
Underground drill programs in the second quarter of 2025 targeted Mahler, New Fold, N2D and Mud Pond. Underground drilling totaled 21 drill holes and 8,894ft (2,710 m). All underground drilling was completed with Company-owned underground drills by Company employees. Drilling continues to hit mineralization at anticipated grades outside of the existing life of mine model signifying mine life expansion potential.
Surface drilling continued with Company drills in the second quarter with drilling at Pleasant Valley and Pork Creek for a total of 3,154ft (961.3m). Drilling for 2025 is expected to continue at previously outlined targets including Parish.
Quality Assurance and Quality Control
Core drilling was completed using ESM owned and operated drills which produced AWJ (1.374 in) size drill core. All core was logged by ESM employees. The core was washed, logged, photographed, and sampled. All core samples were cut in half, lengthwise, using a diamond saw with a diamond-impregnated blade and sampled on 5 ft intervals with adjustments made to match geological contacts. After a sample is cut, one half of the core was returned to the original core box for reference and long-term storage. The second half was placed in a plastic or cloth sample bag, labeled with the corresponding sample identification number, along with a sample tag. All sample bags were secured with staples or a draw string, weighed and packed in shipping boxes.
Shipping boxes are placed on pallets and shipped by freight to ALS Geochemistry (“ALS”), an independent ISO/IEC accredited lab located in Sudbury, Ontario, Canada. ALS prepares a pulp of all samples and sends the pulps to their analytical laboratory in Vancouver, B.C., Canada, for analysis. ALS analyzes the pulp sample by an aqua regia digestion (ME-ICP41 for 35 elements) with an ICP – AES finish including Cu (copper), Pb (lead), and Zn (zinc). All samples in which Cu (copper), Pb (lead), or Zn (zinc) are greater than 10,000 ppm are re-run using aqua regia digestion (Cu-OG46; Pb-OG46; and Zn-OG46) with the elements reported in percentage (%). Silver values are determined by an aqua regia digestion with an ICP-AES finish (ME-ICP41) with all samples with silver values greater than 100 ppm repeated using an aqua regia digestion overlimit method (Ag-OG46) calibrated for higher levels of silver contained. Gold values are determined by a 30 g fire assay with an ICP-AES finish (Au-ICP21).
Mr. Taylor has a fulsome staff of experts on-site that thoroughly review and verify ESM technical data on a regular basis, as described above. For this reason, Mr. Taylor has relied entirely on such verification procedures for verifying the scientific and technical data in this news release. Mr. Taylor has not identified any legal, political, environmental, or other risks that could materially affect the potential development of the mineral resources disclosed herein.
Qualified Person
The scientific and technical information contained in this news release has been reviewed and approved by Donald R. Taylor, MSc., PG, Chief Executive Officer of the Company. Mr. Taylor is a qualified person for the purposes of NI 43-101. Mr. Taylor has more than 25 years of mineral exploration and mining experience and is a Registered Professional Geologist through the SME (Registered Member #4029597).
Non-GAAP Performance Measures
This document includes non-GAAP performance measures, discussed below, that do not have a standardized meaning prescribed by IFRS. The performance measures may not be comparable to similar measures reported by other issuers. The Company believes that these performance measures are commonly used by certain investors, in conjunction with conventional GAAP measures, to enhance their understanding of the Company's performance. The Company uses these performance measures extensively in internal decision-making processes, including to assess how well the Empire State Mine is performing and to assist in the assessment of the overall efficiency and effectiveness of the mine site management team. The tables below provide a reconciliation of these non-GAAP measures to the most directly comparable IFRS measures as contained within the Company's issued financial statements.
C1 Cash Cost Per Payable Pound Sold
C1 cash cost is a non-GAAP measure. C1 cash cost represents the cash cost incurred at each processing stage, from mining through to recoverable metal delivered to customers, including mine site operating and general and administrative costs, freight, treatment and refining charges.
The C1 cash cost per payable pound sold is calculated by dividing the total C1 cash costs by payable pounds of metal sold.
All-in Sustaining Costs
AISC measures the estimated cash costs to produce a pound of payable zinc plus the estimated capital sustaining costs to maintain the mine and mill. This measure includes the C1 cash cost and capital sustaining costs divided by pounds of payable zinc sold. AISC does not include depreciation, depletion, amortization, reclamation and exploration expenses.
| Q2 2025 | Q2 2024 | |||||||||||
| $ | $/lb | $ | $/lb | |||||||||
| Pounds of payable zinc sold (millions) | 16.0 | 14.7 | ||||||||||
| Operating expenses and selling costs | $ | 12,750 | $ | 0.80 | $ | 9,652 | $ | 0.66 | ||||
| Concentrate smelting and refining costs | 1,671 | 0.10 | 1,913 | 0.13 | ||||||||
| Total C1 cash cost | $ | 14,421 | $ | 0.90 | $ | 11,565 | $ | 0.79 | ||||
| Sustaining capital expenditures | 27 | 0.00 | – | 0.00 | ||||||||
| AISC | $ | 14,448 | $ | 0.90 | $ | 11,565 | $ | 0.79 | ||||
Net Debt
Net debt is calculated as the sum of the current and non-current portions of long-term debt, net of the cash and cash equivalent balance as at the balance sheet date. A reconciliation of net debt is provided below.
| Q2 2025 | Q2 2024 | |||||||||||
| Current portion of debt | $ | 29,135 | $ | 36,177 | ||||||||
| Non-current portion of debt | 3,254 | – | ||||||||||
| Total debt | $ | 32,389 | $ | 36,177 | ||||||||
| Less: Cash and cash equivalents | (8,142 | ) | (5,547 | ) | ||||||||
| Net debt | $ | 24,247 | $ | 30,630 | ||||||||
On July 21, 2025, subsequent to the end of Q2 2025, the Company restructured a $16.5 million dollar loan due to a related party. The loan has an approximate three-year term at 8% per annum. Approximately $9 million of the loan has been reclassified as non-current debt, thereby improving the Company’s working capital position significantly.
About Titan Mining Corporation
Titan is an Augusta Group company which produces zinc concentrate at its 100%-owned Empire State Mine located in New York state. Titan’s goal is to deliver shareholder value through operational excellence, development and exploration. We have a strong commitment towards developing critical minerals assets which enhance the security of the domestic supply chain. For more information on the Company, please visit our website at www.titanminingcorp.com
Past performance is not an indicator of future returns. NIA is not an investment advisor and does not provide investment advice. Always do your own research and make your own investment decisions. This message is meant for informational and educational purposes only and does not provide investment advice.