Yield Curve Rapidly Uninverting, Very Bullish for Gold
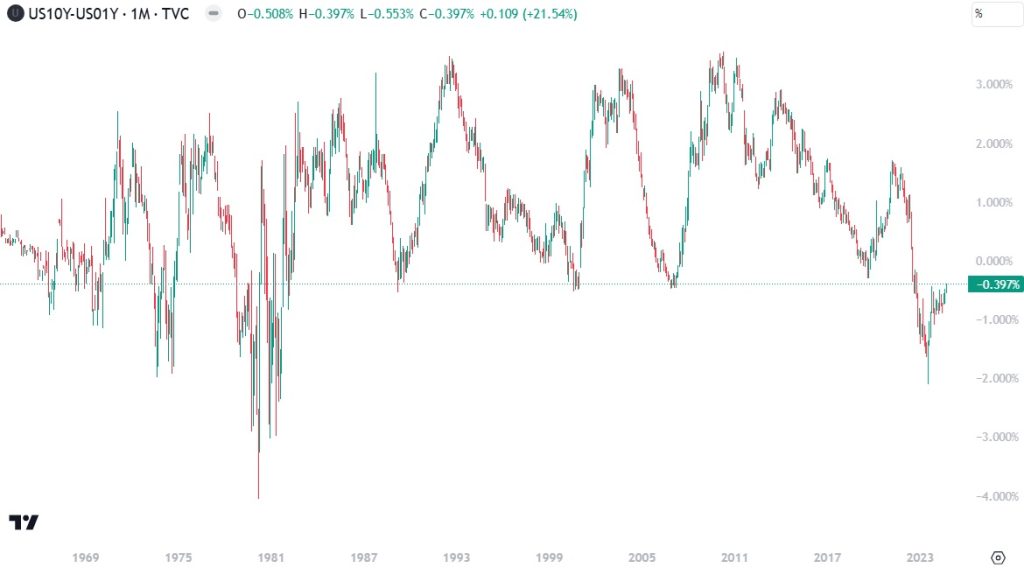
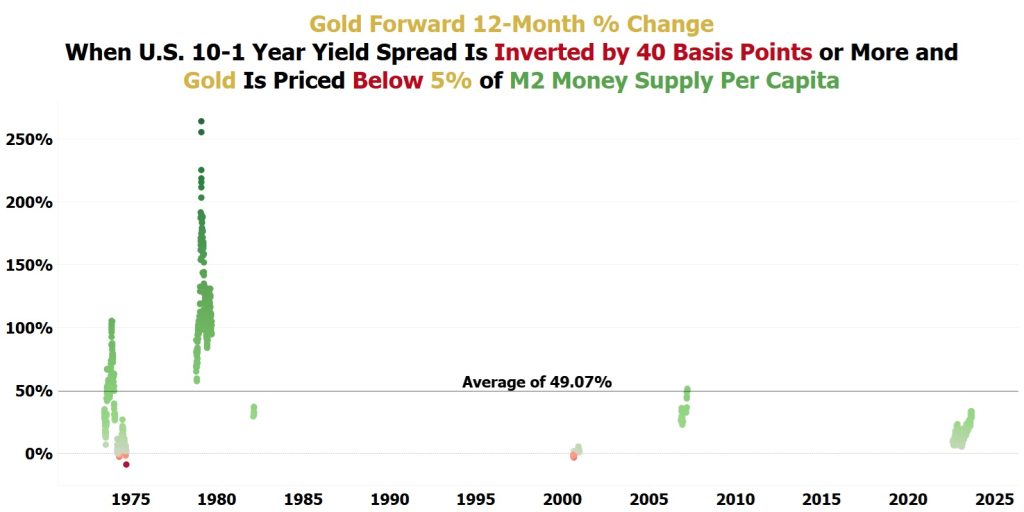
Less than one year ago on September 29, 2023, NIA sent out an alert highlighting how the U.S. Treasury 10 minus 1 year yield spread was inverted by -90 basis points. NIA created an exclusive chart showing how when the U.S. Treasury 10 minus 1 year yield spread is inverted by -40 basis points or more with a gold price of less than 5% of M2 Money Supply Per Capita, gold averages a gain of 60.56% over the following twelve months.
Gold was $1,848.10 per oz on September 29, 2023, and gold settled yesterday at $2,497.09 per oz. Gold has gained by 35.12% in less than twelve months, but this is actually below the long-term average gold price gain under these conditions. Gold’s largest short-term gains typically occur in the months following the yield curve uninverting, which is when the recession begins, and gold stocks begin to lead the market as the #1 largest percentage gainers. On Friday, the U.S. Treasury 10 minus 1 year yield spread returned to above the critical -40 basis point inversion level for the first time since October 2022, which is a sign that the yield curve is getting ready to uninvert and the recession is imminent alongside a massive stampede into the highest quality gold mining/exploration stocks. Ever since October 2022 when the U.S. Treasury 10 minus 1 year yield spread inverted to below -40 basis points, gold has consistently achieved positive forward 12-month returns, and gold’s forward 12-month returns have been steadily increasing. NIA has created an updated chart to account for the last 23 months of the U.S. Treasury 10 minus 1 year yield spread being inverted by -40 basis points. Gold now achieves an average forward 12-month gain of 49.07% under these conditions. From gold’s Thursday settlement price of $2,509.55 per oz (the most recent day meeting these conditions), a forward 12-month gain of 49.07% would result in gold reaching $3,741 per oz by this time next year. Past performance is not an indicator of future returns. NIA is not an investment advisor and does not provide investment advice. Always do your own research and make your own investment decisions. This message is meant for informational and educational purposes only and does not provide investment advice.