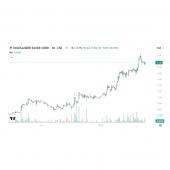
The Apple (AAPL) bubble is bursting with AAPL down by 2.43% today, after declining by 4.8% on Friday, declining by 0.73% on Thursday, declining by 1.55% on Wednesday, and declining by 0.43% on Tuesday. This is AAPL's 5th straight down day, and the crash has just begun!
Gold is the most under owned asset in the world and demand for gold will explode in the weeks ahead as safe haven dollars rush to exit AAPL!
NIA has been consistently predicting for well over a year now that gold's biggest breakout in history will occur after AAPL begins to collapse!
To understand how much the AAPL bubble has kept gold artificially low...
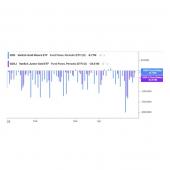
As of the close on Friday, August 4th, SPDR Gold Trust (GLD) had the following fund flows for these trailing time periods:
GLD total trailing 1-week fund flows: -$440 million
GLD total trailing 2-week fund flows: -$820 million
GLD total trailing 1-month fund flows: -$720 million
GLD total trailing 2-month fund flows: -$2.04 billion
GLD total trailing 3-month fund flows: -$1.41 billion
GLD total trailing 6-month fund flows: -$720 million
GLD total trailing 12-month fund flows: -$4.94 billion
GLD total trailing 24-month fund flows: -$5.87 billion
GLD total trailing 36-month fund flows: -$18.28 billion
All nine of these time periods have seen severe outflows from GLD, with recency bias causing investors to incorrectly view AAPL as the new safe haven store of value. In fact, CNBC and other financial mainstream media news outlets have given gold the "Ron Paul treatment" by pretending gold doesn't exist. The last thing that CNBC wants to do is draw attention to this month's 2023 BRICS summit in Johannesburg (begins two weeks from tomorrow) and how dozens of countries are rapidly signing up to ditch the U.S. dollar in favor of a new gold backed currency for trading.
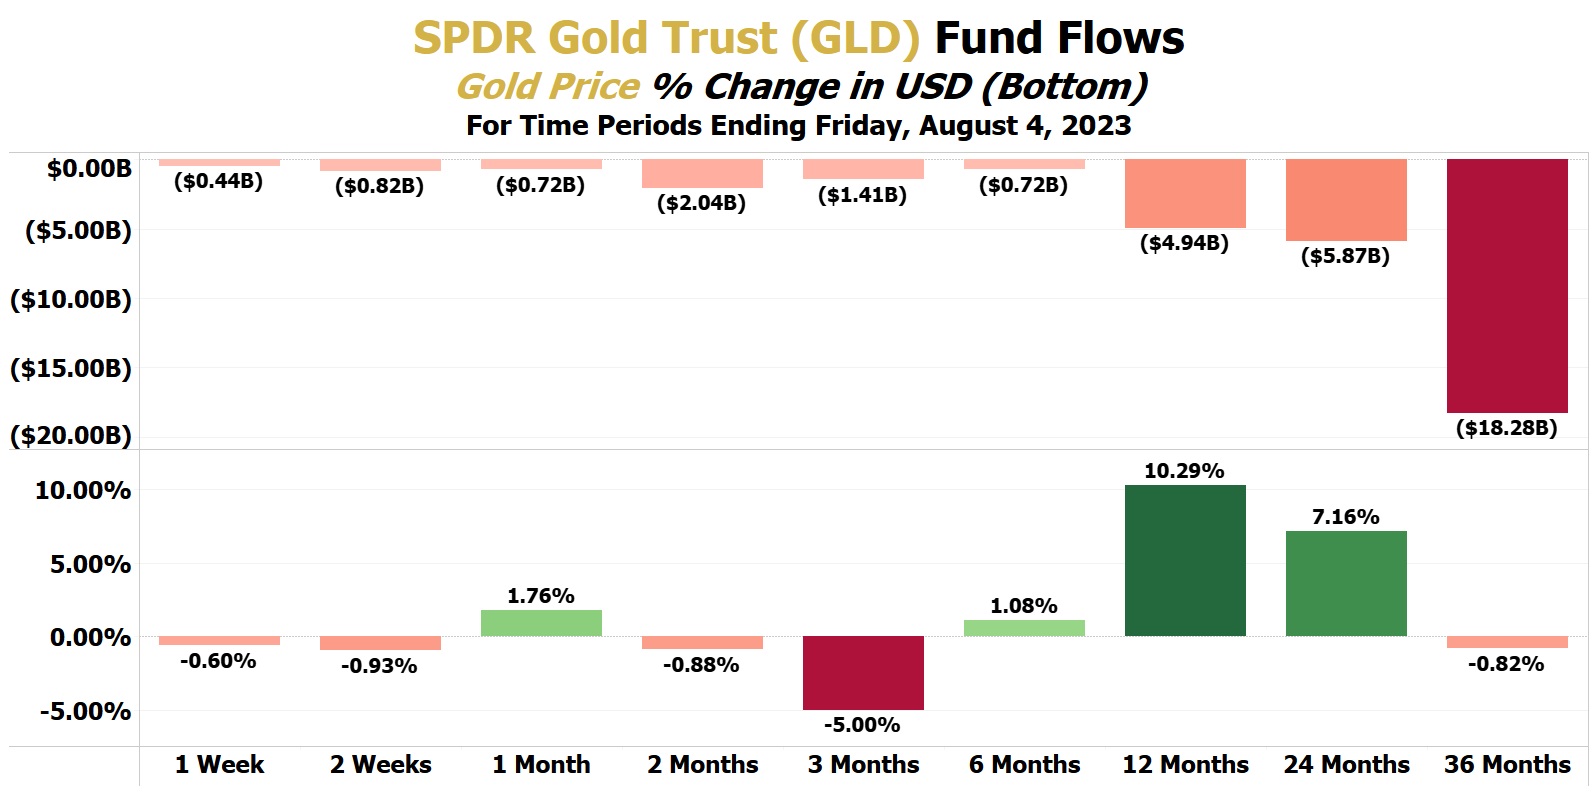
Despite Americans having cashed out of their gold ETFs in recent years, global gold demand remains strong, and gold is up by 10.29% over the last 12 months. Gold is also up by 1.76% over the last month and is up by 1.08% over the last 6 months, and up by 7.16% over the last 24 months.
For gold to be trading so strongly despite most Americans dumping GLD in recent years, is one of the most bullish signs possible that gold will make MASSIVE gains in the upcoming weeks and months...
NIA has created an exclusive chart that allows us to see all historical instances of GLD experiencing outflows for all nine of these trailing time periods ranging from 1 week up to 36 months. Since GLD's inception it has experienced outflows for all nine of these trailing time periods simultaneously only 8.07% of the time.
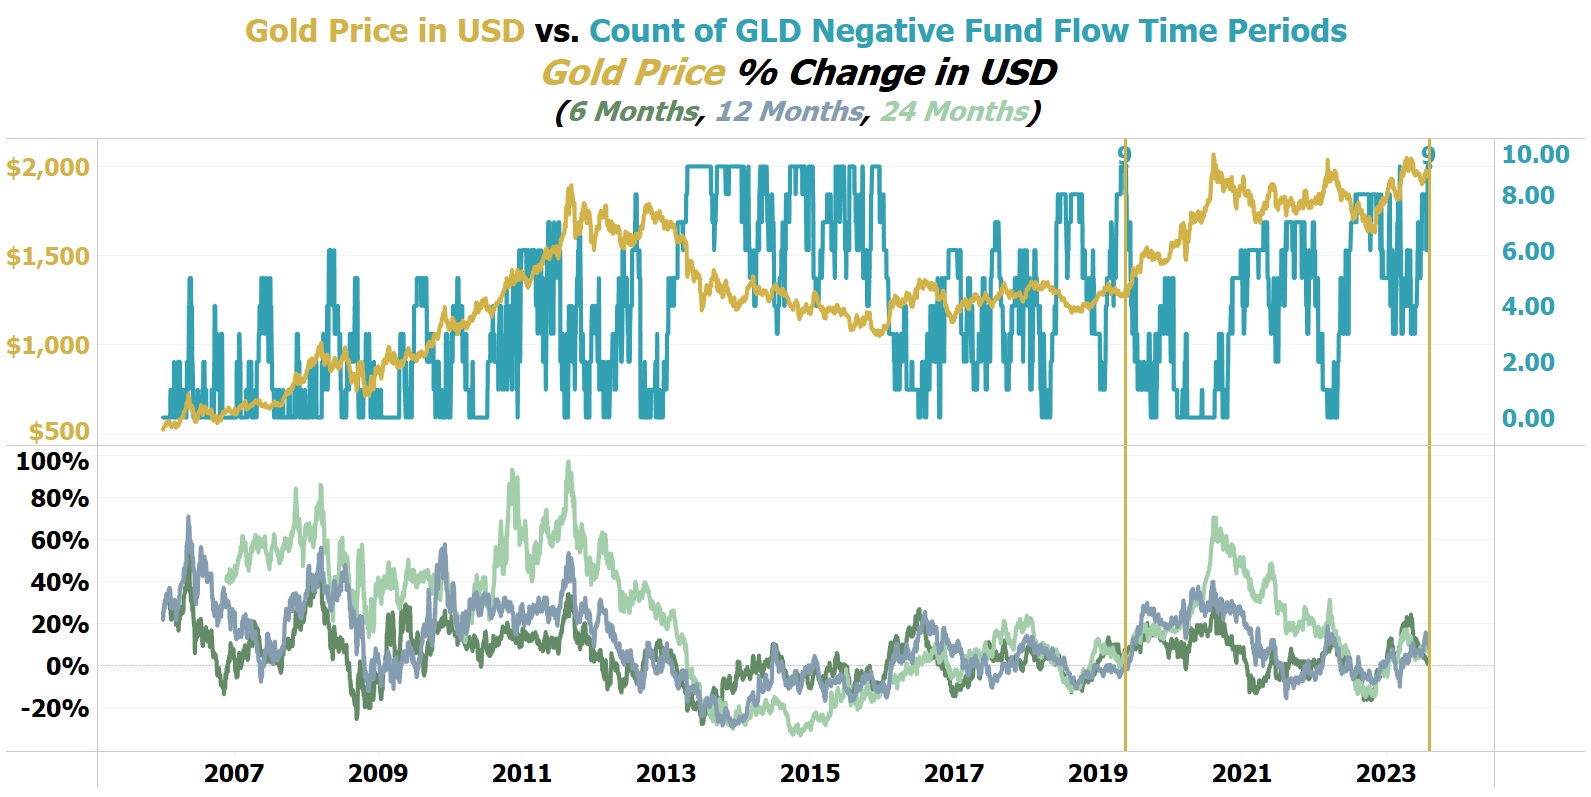
What makes today exceptionally rare is for GLD to experience outflows for all nine of these trailing time periods alongside gold achieving positive returns for the trailing 6, 12, and 24-month time periods. Today's exceptionally rare scenario only occurs 0.1648% of the time including its occurrences during the last five straight trading days!
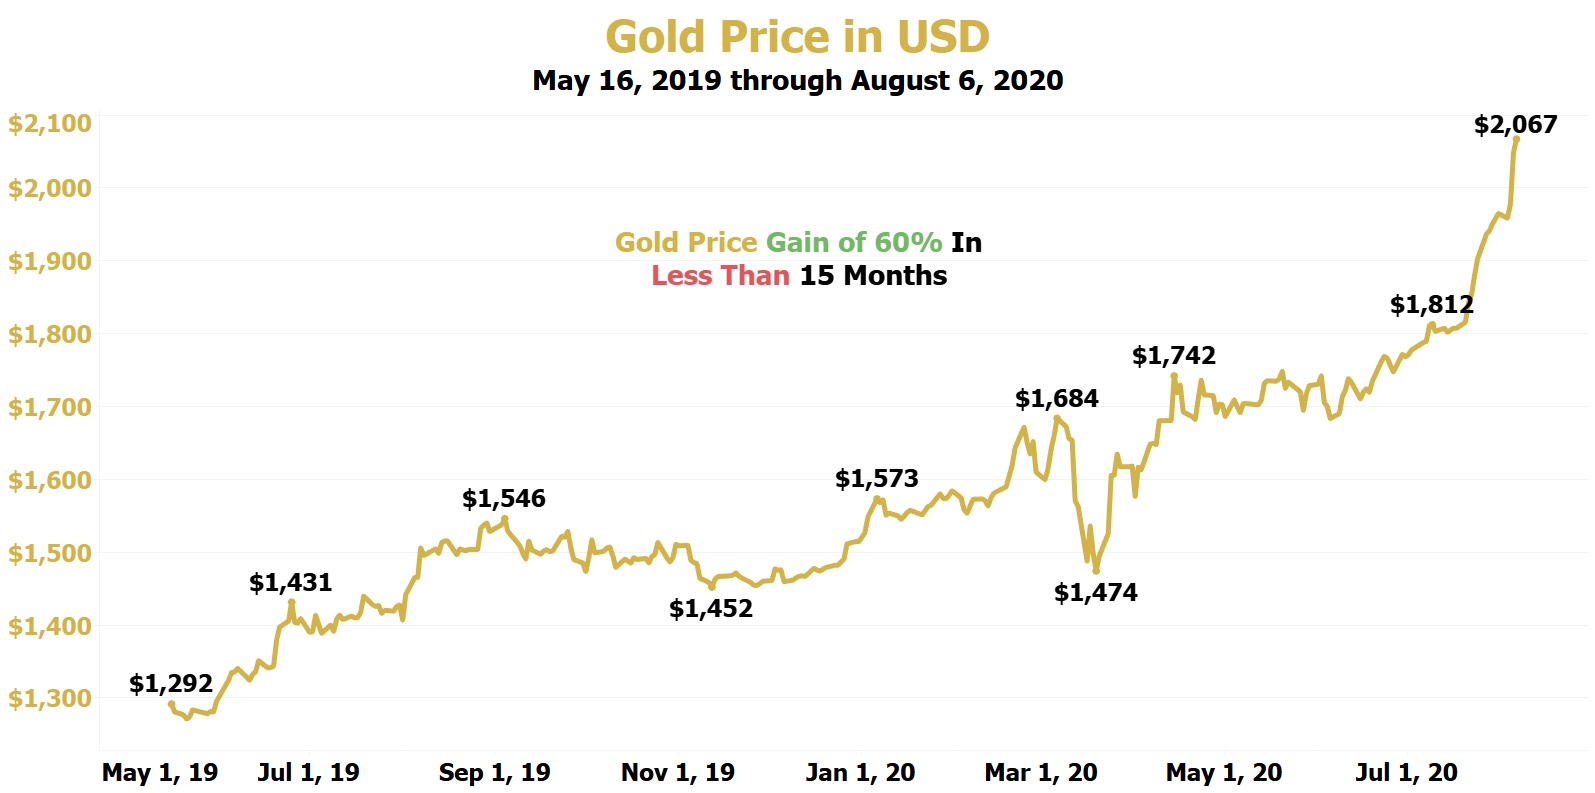
Prior to the last five trading days, today's exceptionally rare scenario has only occurred on two prior trading days: May 15, 2019, and May 16, 2019.
Look how gold traded in the 15 months after May 16, 2019:
Preparing Americans for Hyperinflation