


Articles
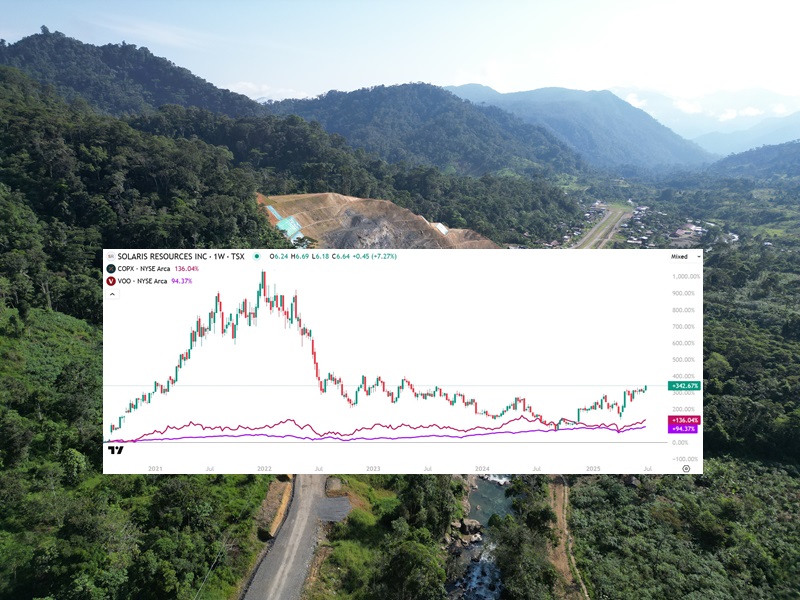
Solaris Resources (TSX: SLS) Hits New 26-Month High
On June 12th, NIA sent out an alert saying, "At some point in the not-too-distant…
Articles
Horrible Tragedy This Morning
There was a horrible tragedy this morning. Diogo Jota the superstar football player who had…
Articles
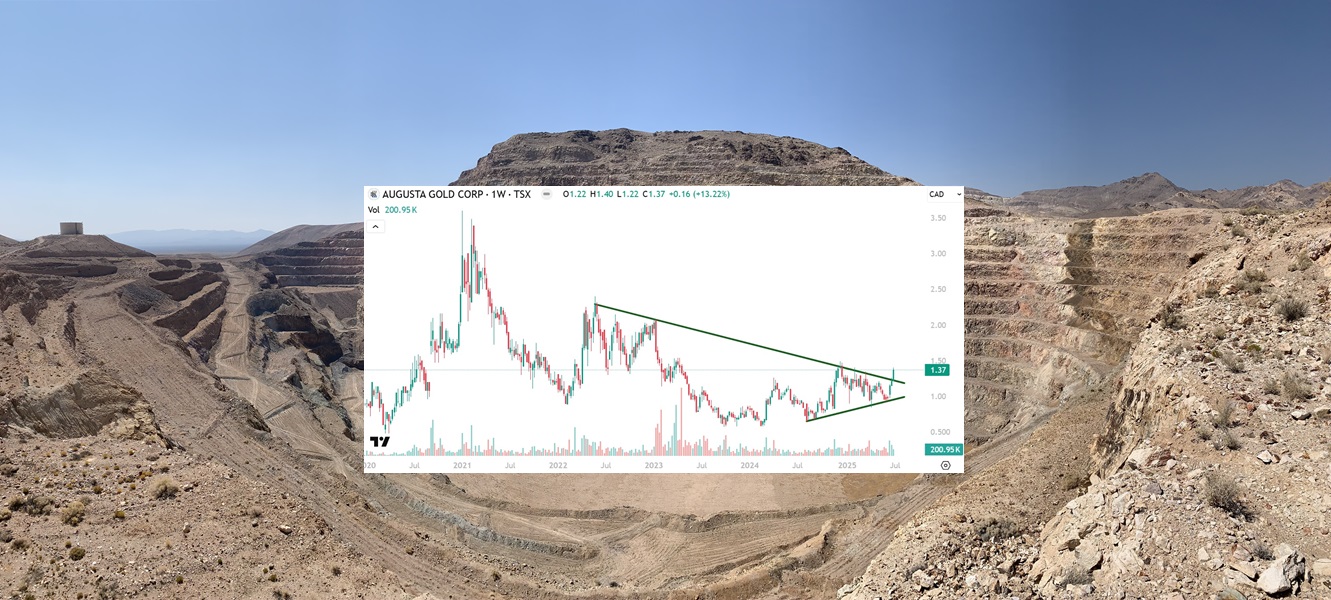
Augusta Gold (TSX: G) Gains by 5.38% to $1.37 Per Share
Augusta Gold (TSX: G) gained by 5.38% today to $1.37 per share and has the…
Articles
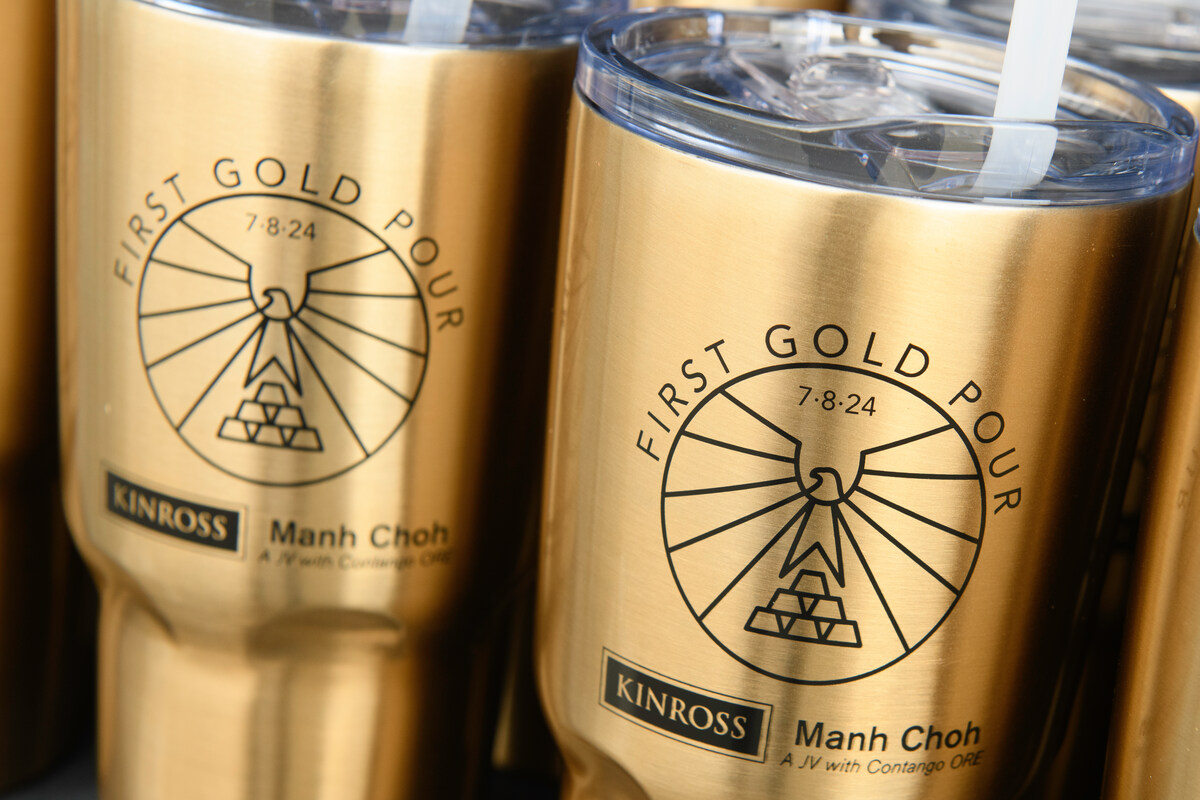
NIA Never Exaggerates We Speak Truth
When we say Contango ORE (CTGO) had the highest free cash flow per share last…
Articles
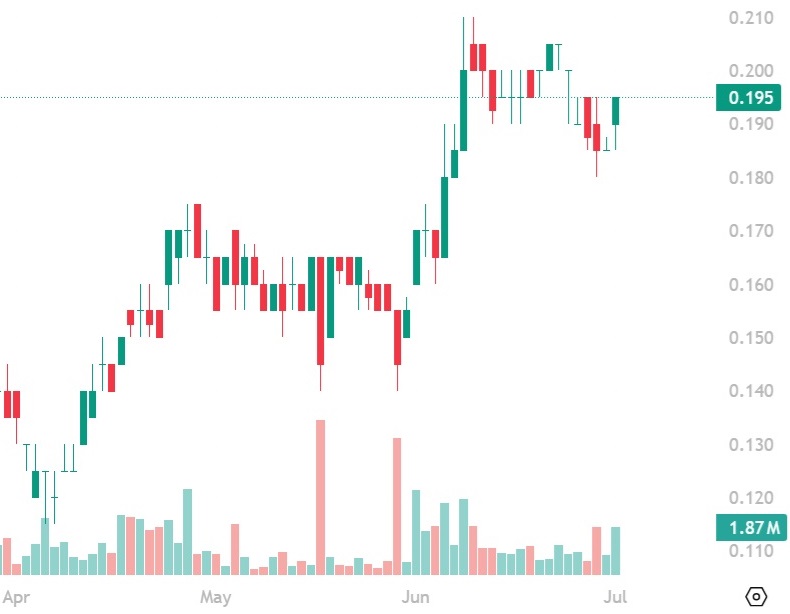
First Mining (TSX: FF) Gains by 5.41% to $0.195 Per Share
First Mining Gold (TSX: FF) gained by 5.41% today to $0.195 per share and its…

Articles
What a Huge Day for BYON and CTGO
Yesterday morning, NIA sent out an alert saying, "Look for Beyond (BYON) to bounce to…
Articles
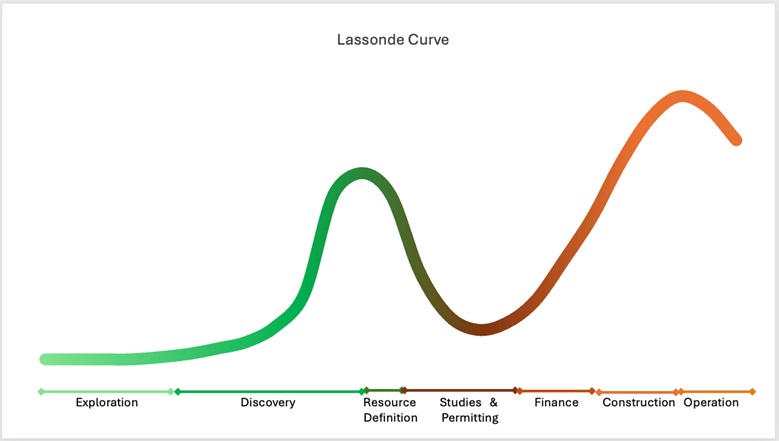
Augusta Gold (TSX: G) and First Mining (TSX: FF) Perfectly Positioned on Lassonde Curve
When you see the gains Augusta Gold (TSX: G) is about to make in the…

Articles
Augusta Gold (TSX: G) Fair Value: $7.20 Per Share
Canadian markets were closed today for a holiday but will reopen tomorrow. From the date…
Articles
Look for Beyond (BYON) Bounce to $8-$10 Per Share
Look for Beyond (BYON) to bounce to $8-$10 per share. It is very high risk…
Technicals
Contango ORE (CTGO) Bouncing Strongly Since Our Alert 24 Hours Ago
Contango ORE (CTGO) is bouncing strongly since our alert 24 hours ago at $18.82 per…