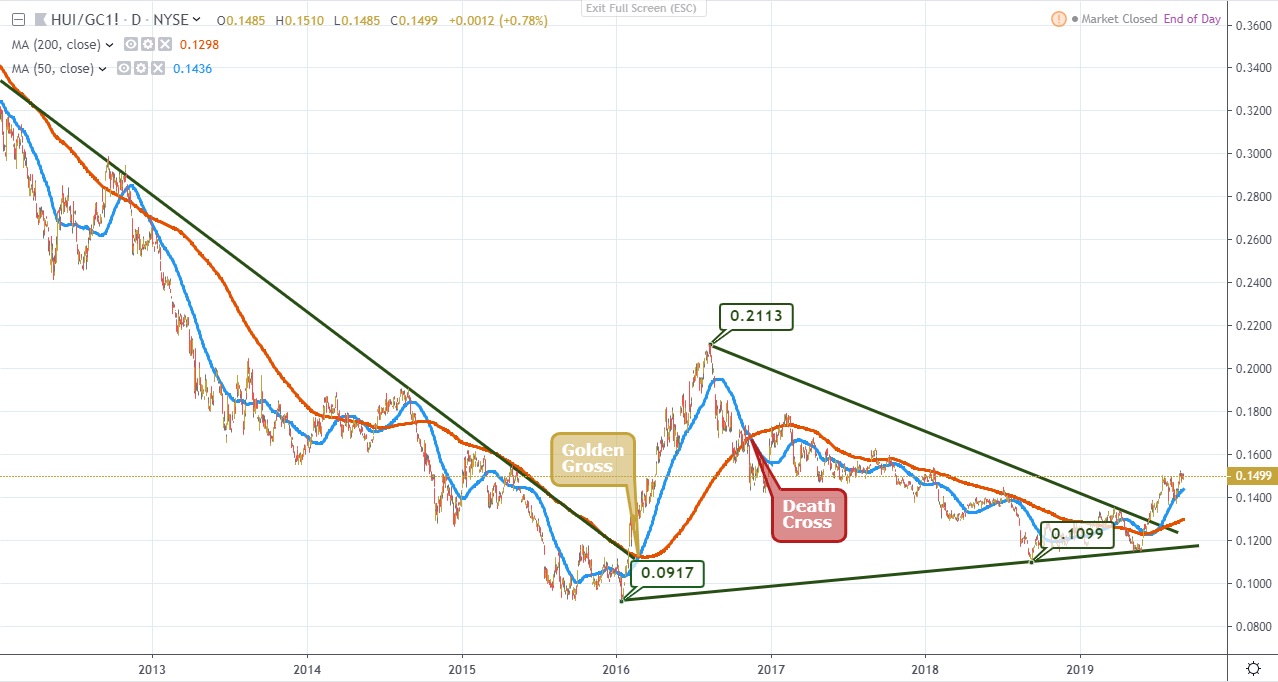
All of NIA's loyal long-term members know that we have been closely analyzing the HUI Gold Bugs Index of unhedged gold miners to gold ratio for over a decade. Back on January 19, 2016, it bottomed at an all-time low of 0.0917. On February 3, 2016, the HUI/Gold Ratio surpassed its key breakout point of 0.113 and over the following six months it exploded by 87% to a medium-term peak of 0.2113.
On February 29, 2016 within the same month of the HUI/Gold Ratio surpassing its key breakout point, its 50-day moving average reached 0.1127 thereby surpassing its 200-day moving average of 0.1125, which is called a golden cross and provided confirmation that an upward explosion was imminent.
After peaking on August 12, 2016 at 0.2113, the HUI/Gold Ratio declined to below its 50-day moving average of 0.1948 on August 23, 2016. Less than three months later on November 15, 2016, its 50-day moving average fell to 0.1676 thereby dropping below its 200-day moving average 0.1684, which is called a death cross and provided confirmation that more downside was still remaining.
The HUI/Gold Ratio reached its latest medium-term bottom of 0.1099 approximately one year ago on September 11, 2018. Afterwards, it reached a short-term peak on April 9, 2019 at 0.1333,.before dipping to its key support level on May 28, 2019 of 0.1149.
On June 14, 2019, the HUI/Gold Ratio surpassed its latest key breakout point of 0.129 and has since exploded to its current level of 0.1499! On July 5, 2019, we saw a new golden cross when its 50-day moving average reached 0.1248 thereby surpassing its 200-day moving average of 0.1247.
Preparing Americans for Hyperinflation