


Articles
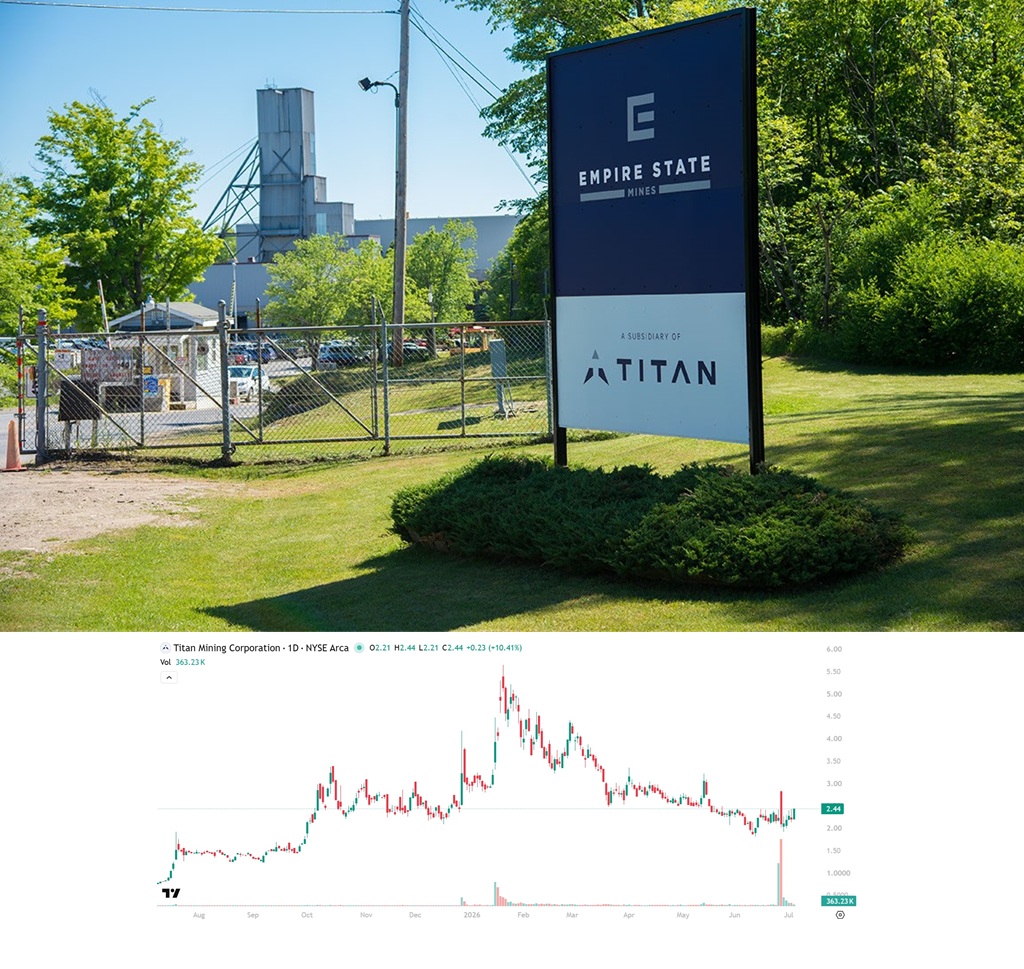
Is Titan Mining Done With the ATM?
NIA explained over the weekend how the purified graphite that Titan Mining (TII) will be…
Articles
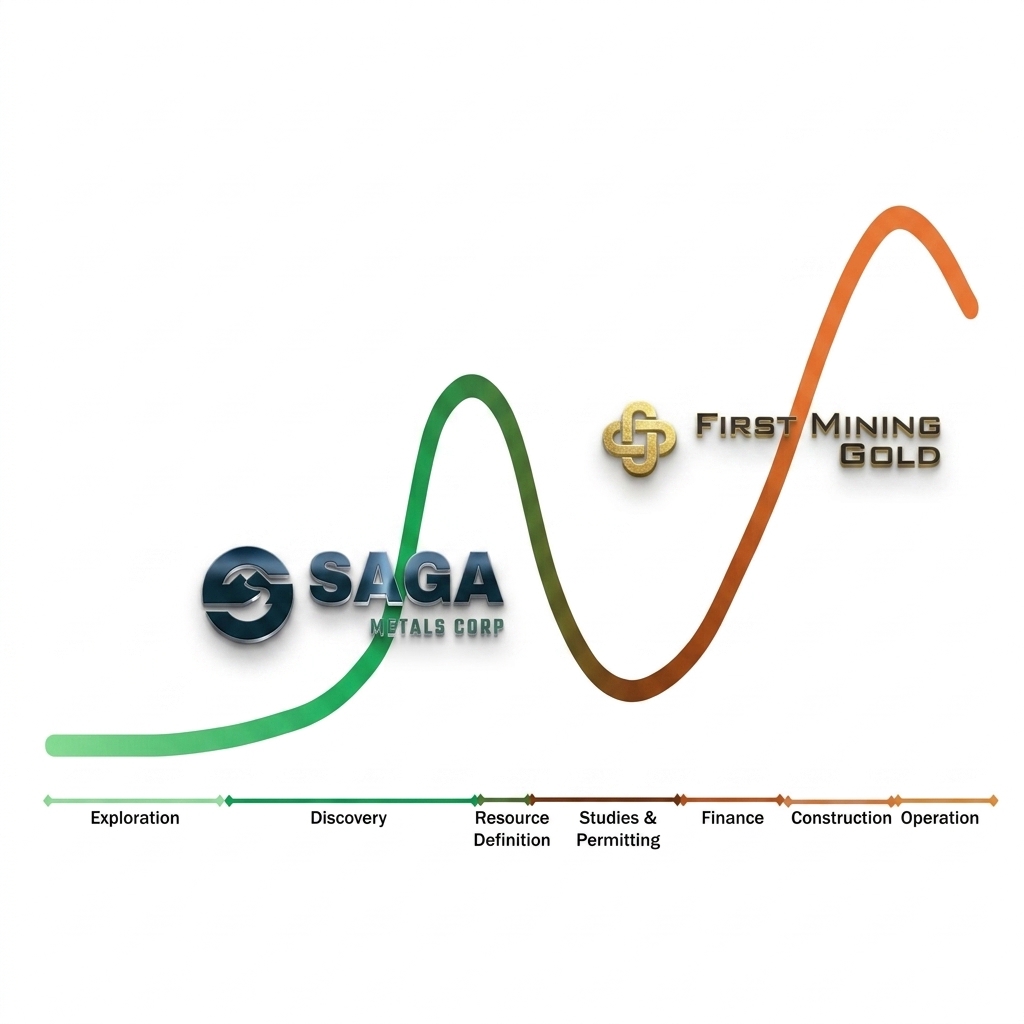
First Mining and SAGA at Best Places on Lassonde Curve
First Mining Gold (TSX: FF) is up another 2.08% this morning to $0.74 per share…
Articles
Hydrograph Finally Collapsing Following Kevin Bambrough Promises of U.S. Army Contracts
On March 13th, with Hydrograph Clean Power (CSE: HG) at $8.12 per share, NIA published…
Articles
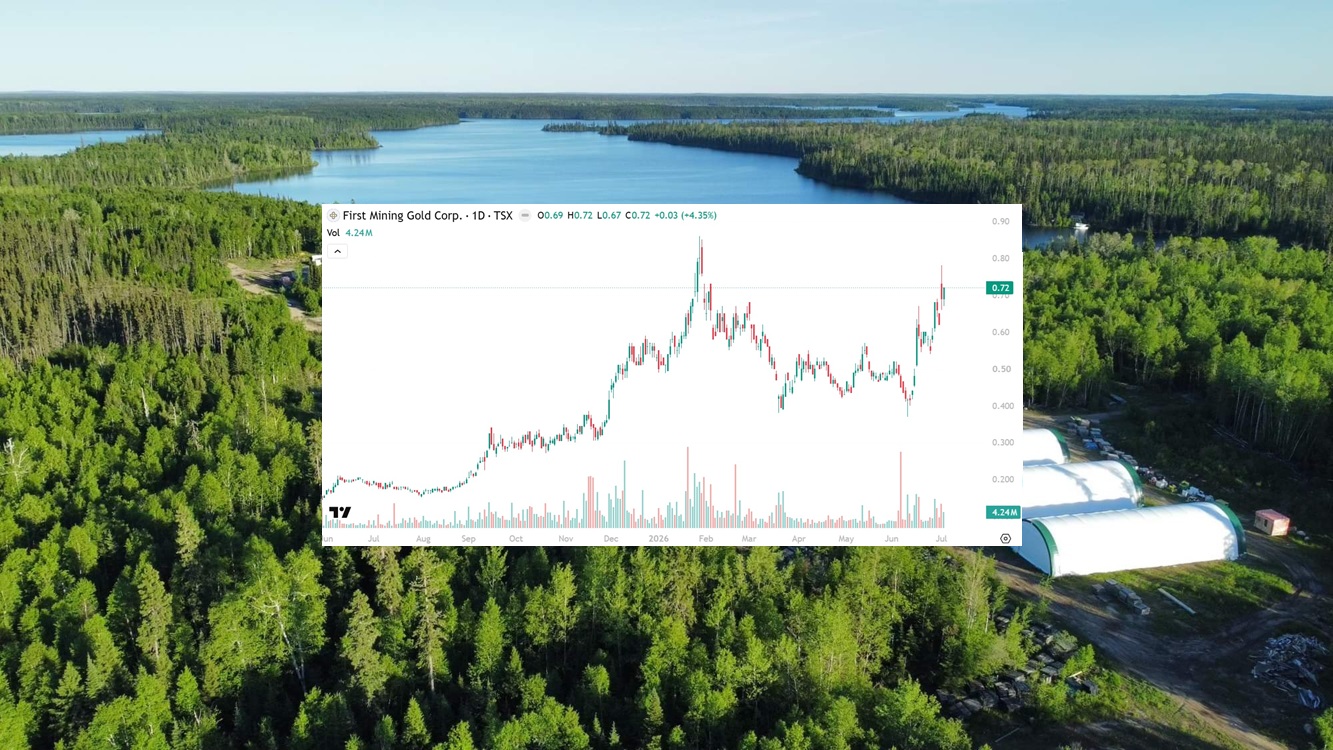
First Mining Surges Another 4.35% to $0.72 and New 52-Week Highs May Be Coming Soon
First Mining Gold (TSX: FF) gained another 4.35% today to $0.72 per share following this…

Technicals
First Mining Soars 11.29% Will Add Billions to GDP and Strengthen Weak Loonie Improving Standard of Living for All Canadians
First Mining Gold (TSX: FF) gained by 11.29% today to $0.69 per share following news…
Articles
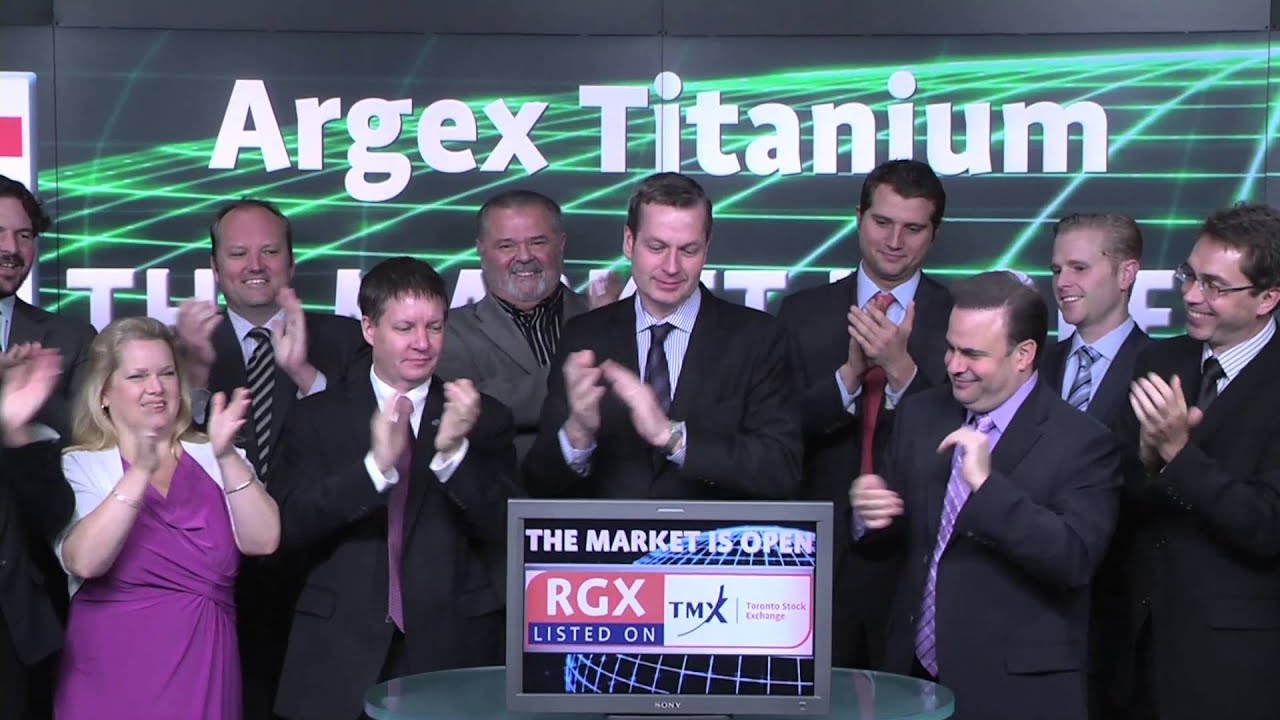
Temas Owns Former Argex Titanium Assets
The La Blache and Lac Brûlé titanium projects of NIA's brand-new #2 favorite overall stock…
Announcement
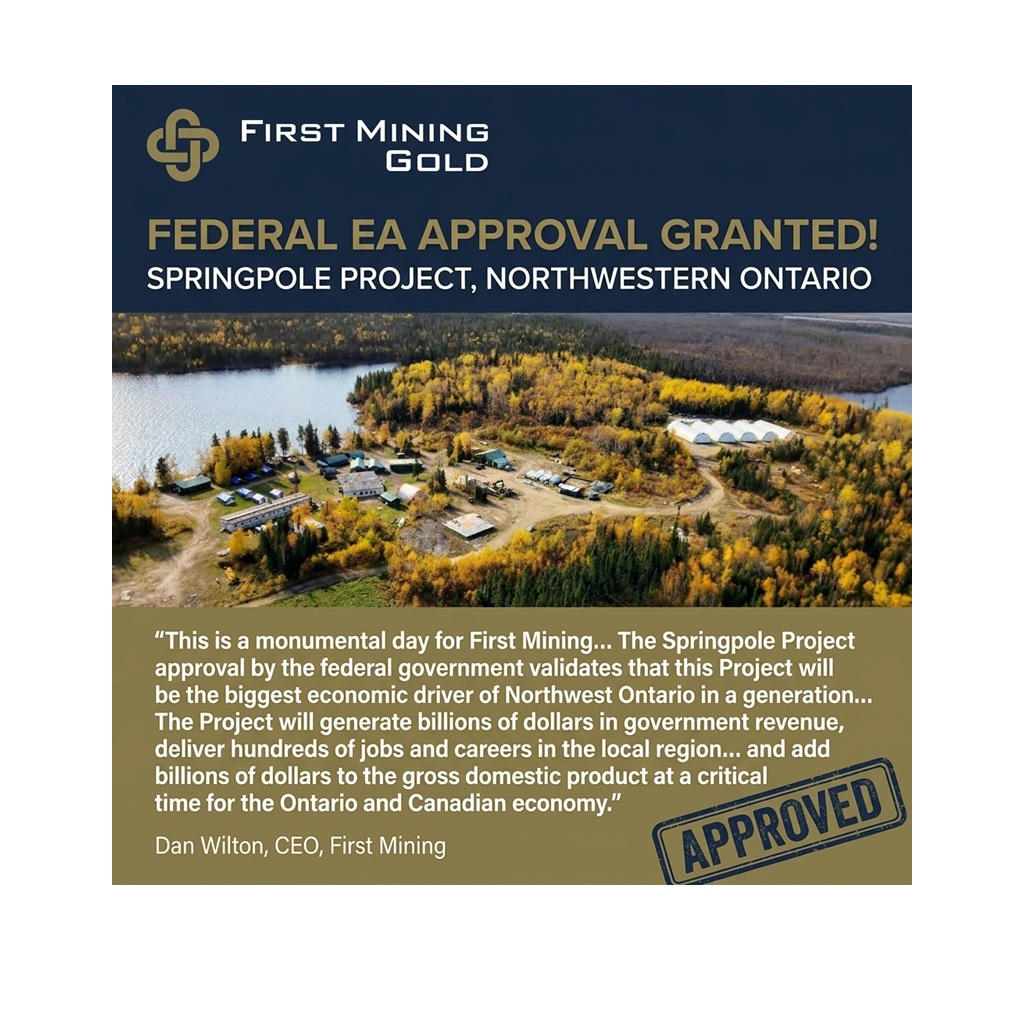
First Mining Receives Federal Approval for the Springpole Gold Project Environmental Assessment
First Mining Receives Federal Approval for the Springpole Gold Project Environmental Assessment Jun 30, 2026,…
Articles
Canada Reaches World Cup Round of 16 Led by Celtic Star Alistair Johnston
Canadian Markets are closed today for Canada Day but will be open on Friday when…
Announcement
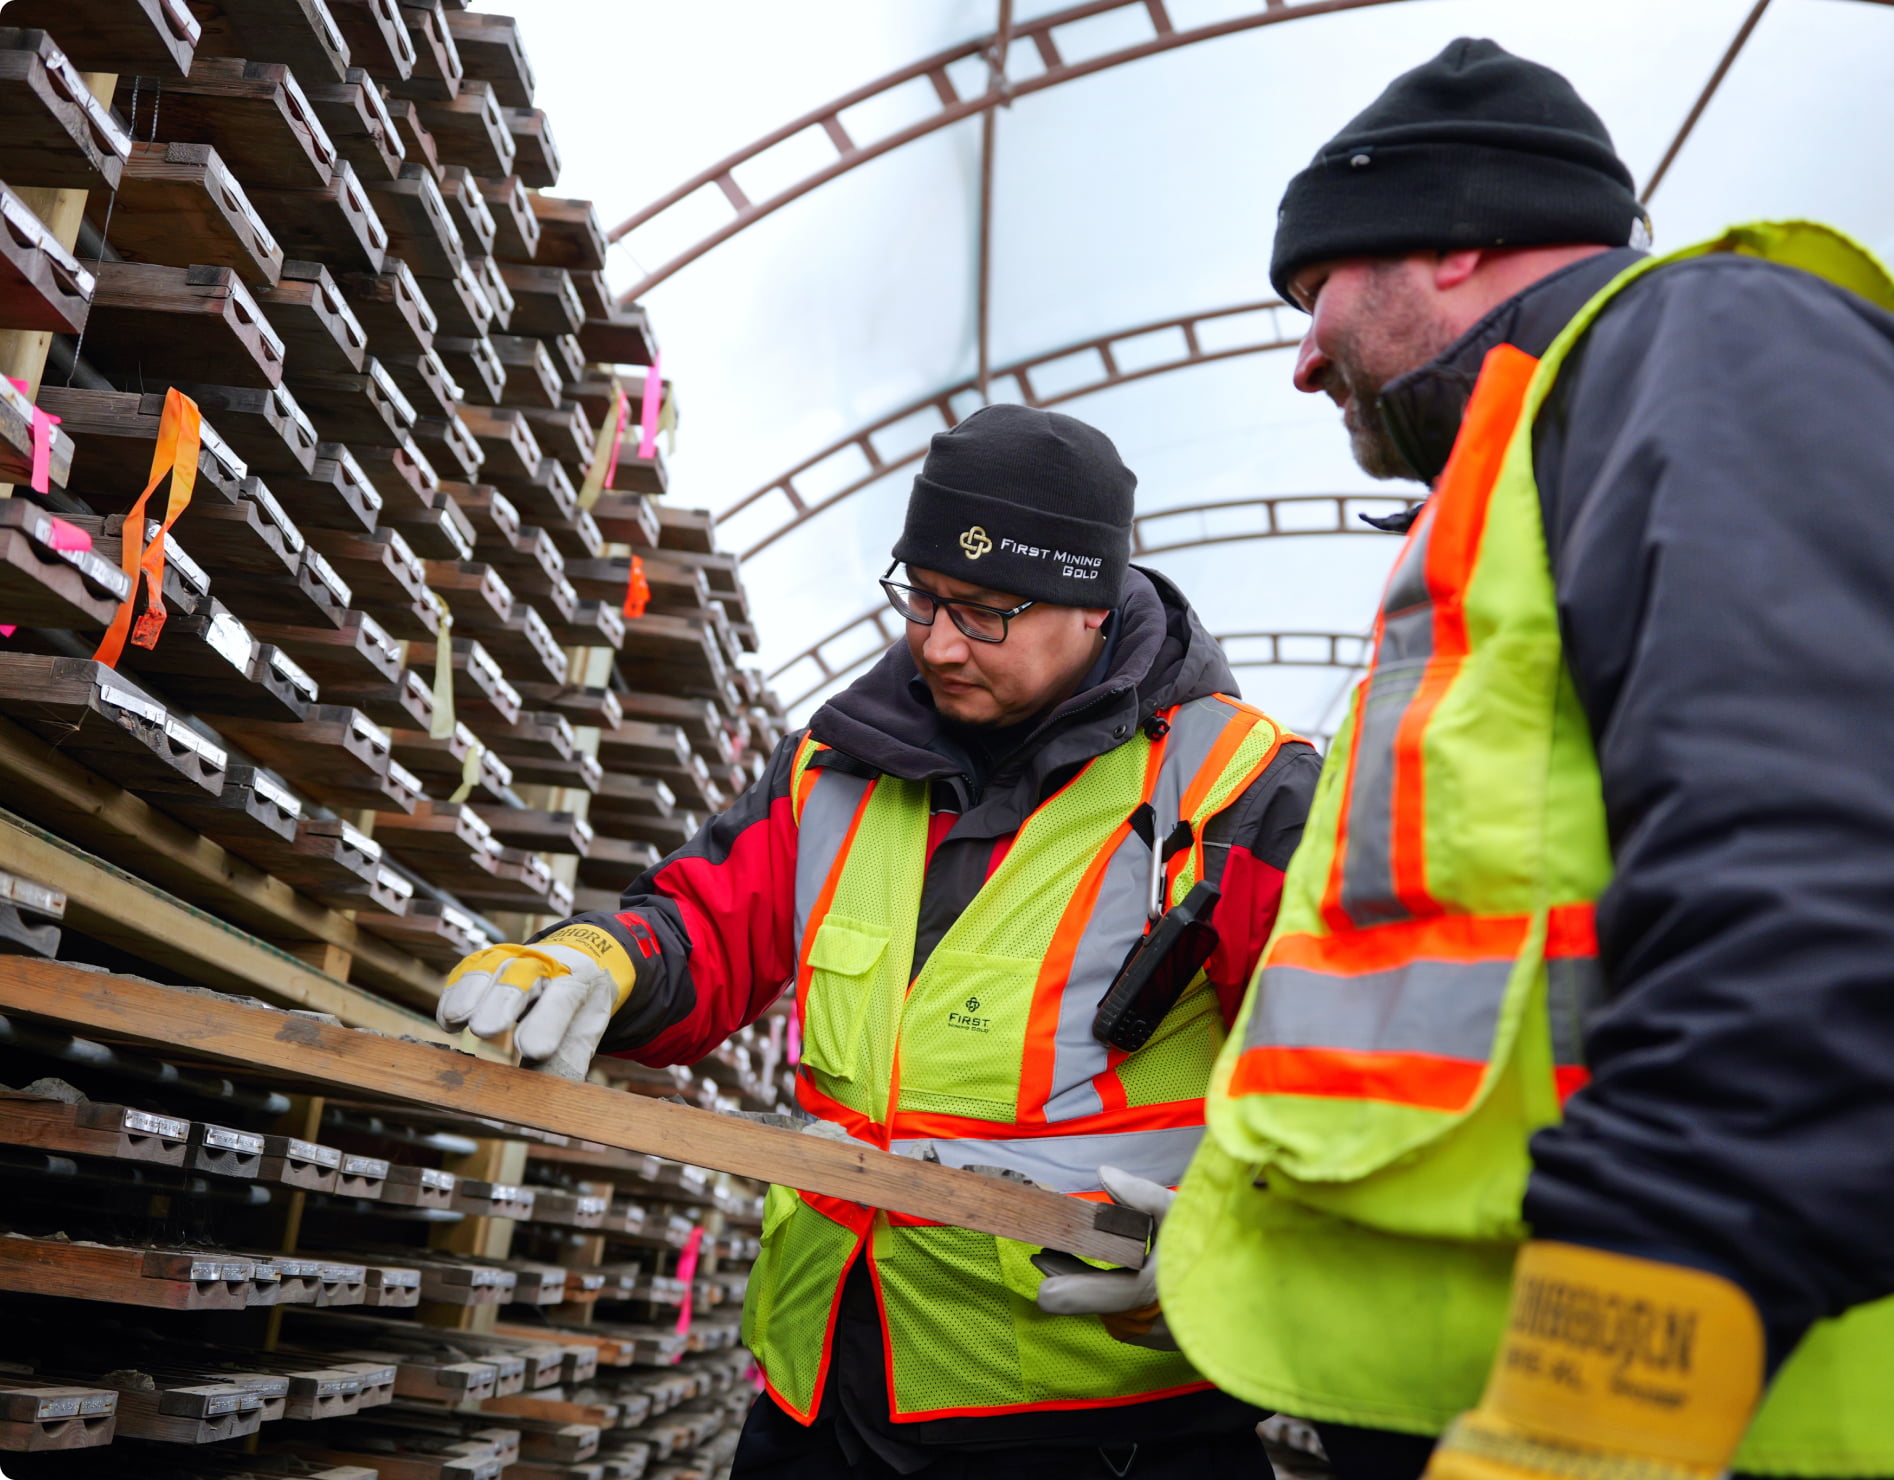
First Mining Completes Final Key Milestone Prior to Federal EA Approval
First Mining Gold (TSX: FF) released huge news after the close. This is one final…
Announcement
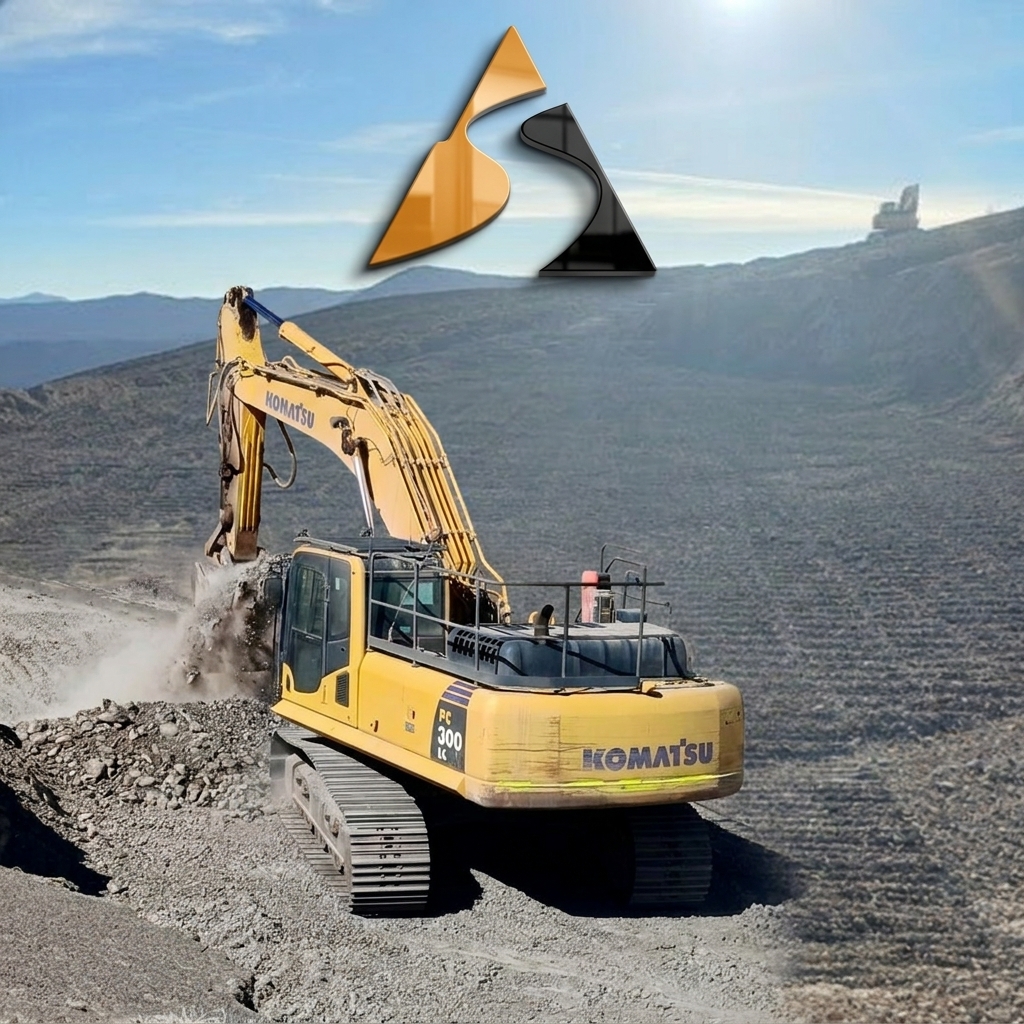
Copper Is Soaring and Billionaire Backed Super Copper Launches Maiden Drill Program in Chile
NIA has been predicting for months that copper will strongly outperform gold moving forward. Copper…