MGG Hits 1,469 g/t AgEq at San Jose as Resource Expansion Drilling Delivers
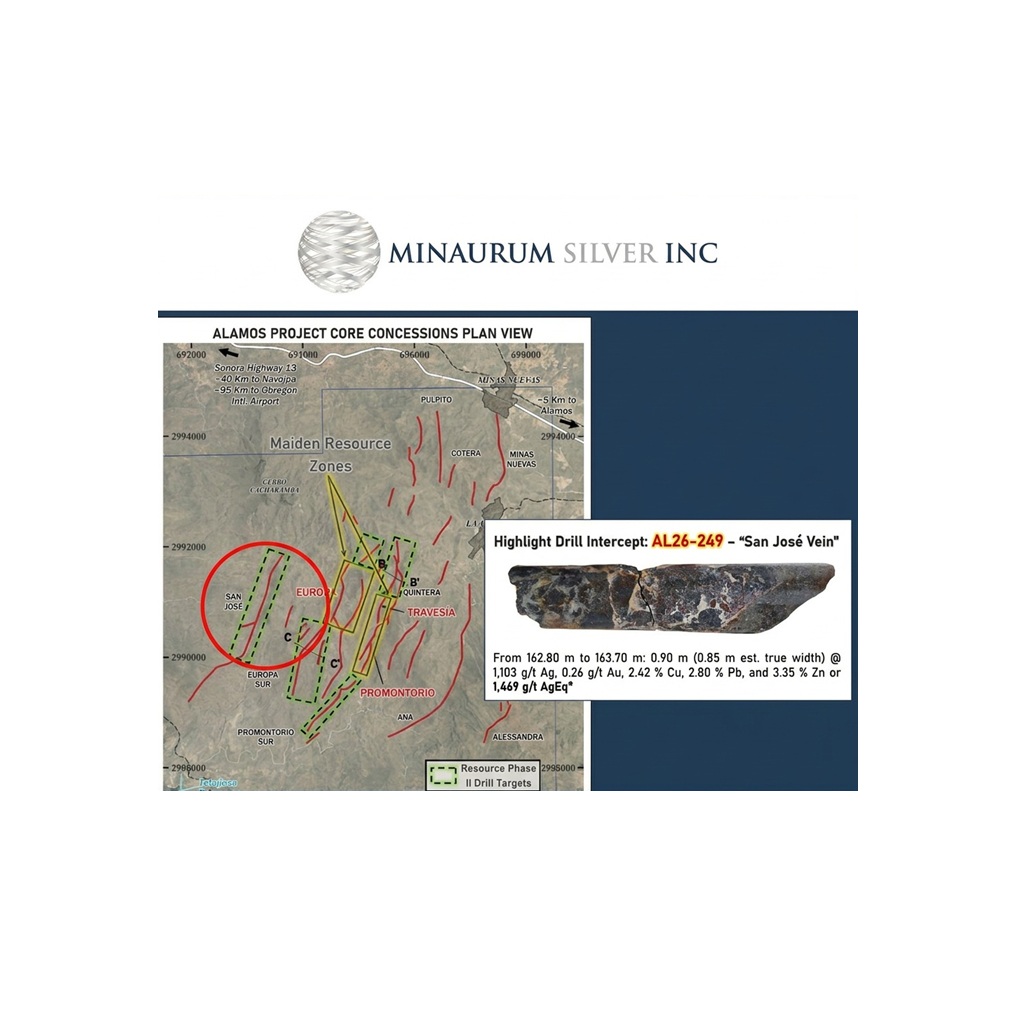
Minaurum Just Hit Silver Grades Above 2,400 g/t AgEq And These Zones Aren’t Even in the Resource Yet
- A monster hit at San Jose: Hole AL26-249 returned 0.50 m of 2,425 g/t AgEq (1,910 g/t Ag, 0.43 g/t Au, 3.90% Cu, 4.71% Zn)… that’s nearly 2 kilograms of silver per tonne.
- Two brand-new zones headed into the resource: Quintera and Europa Sur were excluded from Minaurum’s maiden resource estimate… and both are now delivering high-grade continuity that will be incorporated into the upcoming resource update.
- Step-outs keep working: 3.40 m of 397 g/t AgEq (incl. 0.30 m of 1,433 g/t AgEq) at Europa Sur, and 0.50 m of 1,559 g/t AgEq at Quintera… roughly 100 m down-dip of the previously reported 5.95 m of 1,117 g/t AgEq.
- A new discovery front opens: Promontorio Sur received its first-ever step-out drilling and hit immediately… 0.45 m of 386 g/t AgEq inside a 6 m-wide vein zone, along a structure traceable for more than 1 kilometre. Drilling continues with assays pending.
- Growth on top of growth: These results come from an aggressive, fully active Phase II 50,000-metre resource-expansion program at the 100%-owned, production-permitted Alamos Silver Project in Sonora, Mexico.
- The kicker: Multiple intercepts carry meaningful gold and copper credits alongside silver… and more assays are pending from several zones right now.
Minaurum Resource Step-Out Drilling Returns: 3.40 m of 397 g/t AgEq at Europa Sur, 1.90 m of 323 g/t AgEq at Quintera, and 0.90 m of 1,469 g/t AgEq at San Jose in Alamos Silver Project
Vancouver, British Columbia – September 24, 2026 – Minaurum Silver Inc. (TSXV: MGG) (OTCQX: MMRGF) (“Minaurum” or the “Company”) is pleased to report high-grade silver drill results from the Europa, Quintera, San Jose, and Promontorio Sur Vein Zones, as part of its ongoing Phase II, 50,000-metre resource-expansion drilling program at the Alamos Silver Project (“Alamos”) in Sonora, Mexico.
Highlights
Europa Sur Vein Zone
- 1.60 m of 412 g/t silver equivalent (“AgEq”) (314 g/t Ag, 0.41 g/t Au, 0.42% Cu, 0.41% Pb, 0.78% Zn)
including 0.40 m of 708 g/t AgEq (409 g/t Ag, 1.51 g/t Au, 1.27% Cu, 0.82% Pb, 1.66% Zn) (Hole AL26-233) - 3.40 m of 397 g/t AgEq (237 g/t Ag, 0.20 g/t Au, 0.95% Cu, 0.80% Pb, 1.87% Zn)
including 0.30 m of 1,433 g/t AgEq (1,135 g/t Ag, 0.23 g/t Au, 2.26% Cu, 1.42% Pb, 2.36% Zn) (Hole AL26-246)
Quintera Vein Zone
- 1.90 m of 323 g/t AgEq (263 g/t Ag, 0.02 g/t Au, 0.44% Cu, 0.27% Pb, 0.63% Zn) (Hole AL26-243)
- 0.50 m of 1,559 g/t AgEq (1,460 g/t Ag, 0.04 g/t Au, 1.11% Cu, 0.01% Pb, 0.01% Zn) (Hole AL26-250)
San Jose Vein Zone
- 0.90 m of 1,469 g/t AgEq (1,103 g/t Ag, 0.26 g/t Au, 2.42% Cu, 2.80% Pb, 3.35% Zn)
including 0.50 m of 2,425 g/t AgEq (1,910 g/t Ag, 0.43 g/t Au, 3.90% Cu, 1.60% Pb, 4.71% Zn) (Hole AL26-249)
“Resource-expansion drilling continues to demonstrate the strong continuity of our high-grade silver vein zones… including Quintera and Europa Sur… while the San Jose vein delivered impressive results with silver grades exceeding 1 kg/t. Additionally, Promontorio Sur received its first round of step-out drilling, yielding encouraging initial results, with further assays to be released as they become available.”
Quintera – Travesia Vein Zones
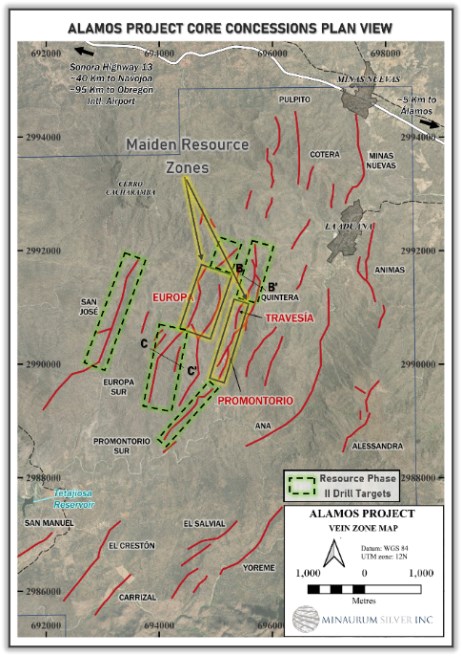
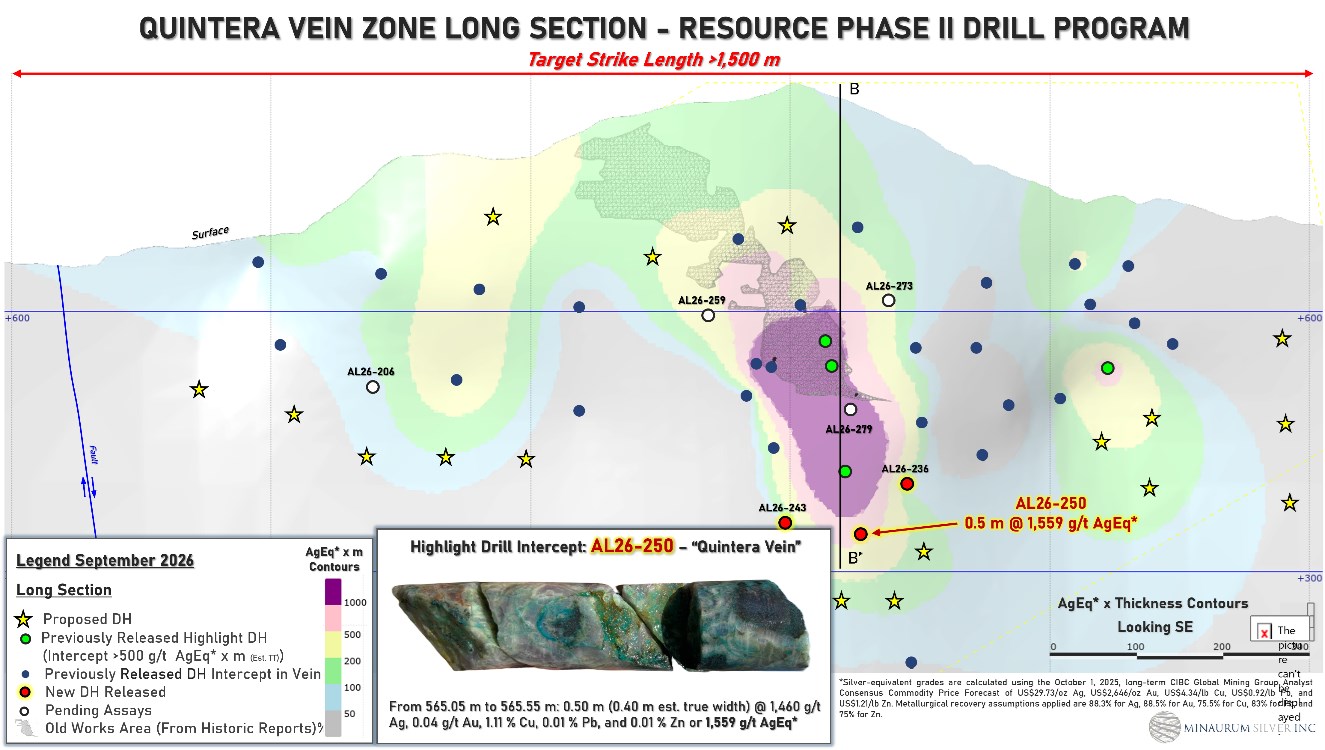
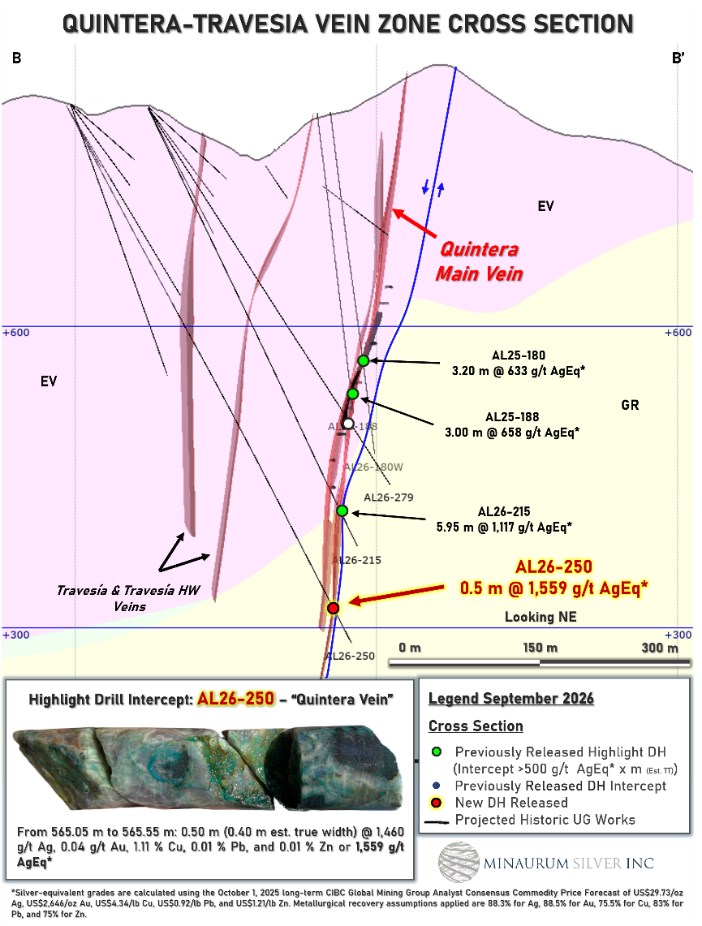
Drilling at Quintera is successfully defining the vertical and horizontal extent of the high-grade silver shoot both below and along strike of the historical workings. Positioned 100 to 150 metres in the hanging wall (western side) of the Quintera vein zone, the Travesia vein zone allows a single drill hole to intersect both systems. Although Quintera was excluded from Minaurum’s initial resource estimate (see news release dated January 28, 2026), it will be incorporated into the upcoming resource update.
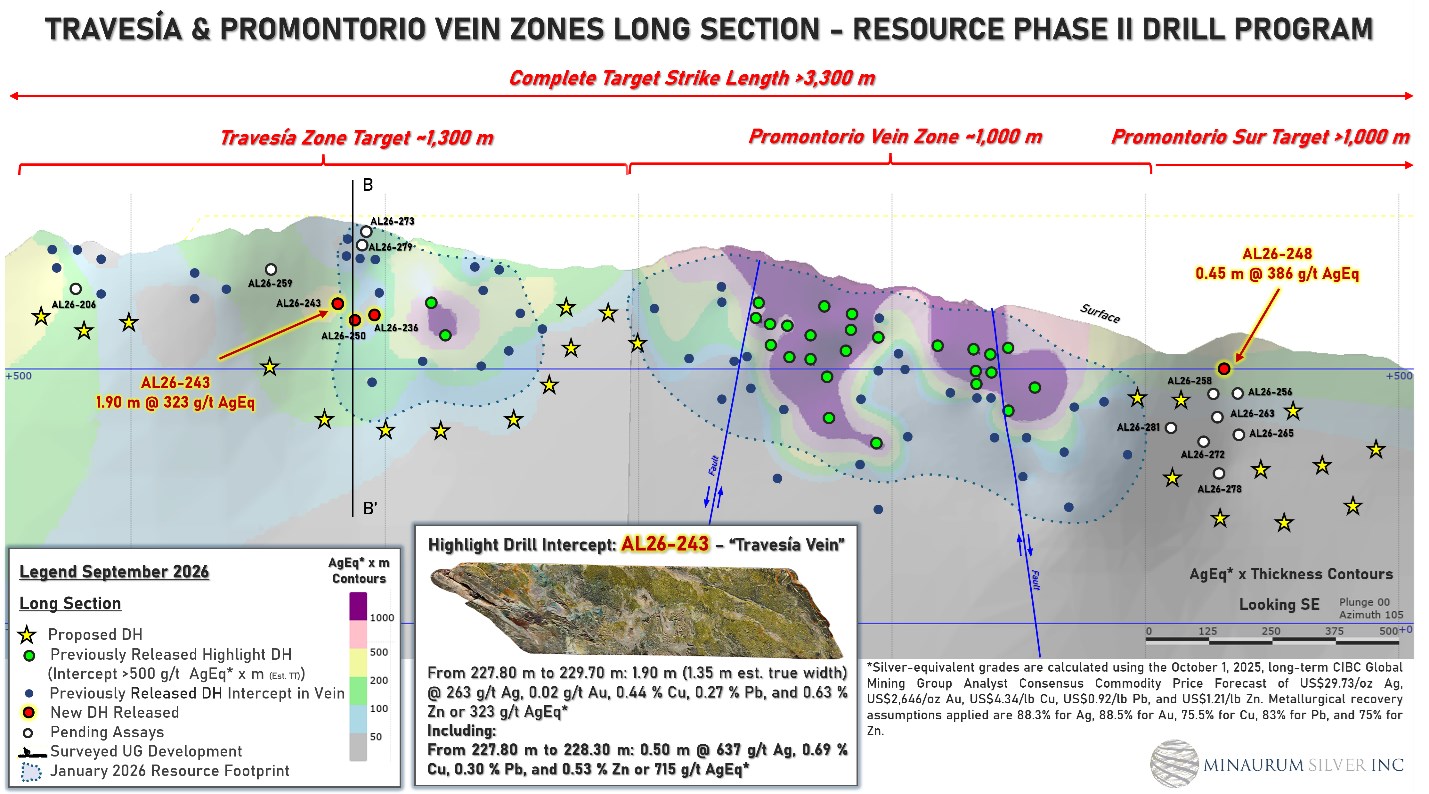
In the Travesia vein zone, hole AL26-243 intersected 1.90 m of 323 g/t AgEq, including 0.50 m of 715 g/t AgEq (637 g/t Ag, 0.69% Cu, 0.30% Pb, 0.53% Zn). Hole AL26-236 and hole AL25-250 cut 0.65 m of 318 g/t AgEq (236 g/t Ag, 0.01 g/t Au, 0.84% Cu, 0.31% Pb, 0.10% Zn) and 0.50 m of 1,559 g/t AgEq, respectively, in the Quintera vein zone. Hole AL26-250 cuts Quintera approximately 100 m down-dip from the 5.95 m of 1,117 g/t AgEq intersection (Hole AL26-215) (see news release dated July 8, 2026), while hole AL26-236 cut the Quintera zone about 80 m to the north and 20 m higher than the AL26-250 intercept (Table 1, Figures 2, 3, and 4).
| Hole | From (m) | To (m) | Interval (m) | True Width (m) |
Ag g/t | Au g/t | Cu % | Pb % | Zn % | AgEq g/t |
|---|---|---|---|---|---|---|---|---|---|---|
| AL26-236 | 341.70 | 342.00 | 0.30 | 0.25 | 162 | 0.00 | 0.45 | 0.11 | 0.02 | 203 |
| 465.15 | 465.80 | 0.65 | 0.50 | 236 | 0.01 | 0.84 | 0.31 | 0.10 | 318 | |
| 491.00 | 491.60 | 0.60 | 0.45 | 70 | 0.11 | 0.25 | 0.27 | 1.33 | 138 | |
| AL26-243 | 227.80 | 229.70 | 1.90 | 1.35 | 263 | 0.02 | 0.44 | 0.27 | 0.63 | 323 |
| including | 227.80 | 228.30 | 0.50 | 0.35 | 637 | 0.00 | 0.69 | 0.30 | 0.53 | 715 |
| AL26-250 | 473.35 | 473.65 | 0.30 | 0.25 | 112 | 0.00 | 0.26 | 0.71 | 0.38 | 157 |
| 565.05 | 565.55 | 0.50 | 0.40 | 1,460 | 0.04 | 1.11 | 0.01 | 0.01 | 1,559 |
True widths are based on current interpretation of mineralized structures. Weight-averaged silver-equivalent grades (AgEq g/t) are based on the October 1, 2025 Long-term CIBC Global Mining Group Analyst Consensus Commodity Price Forecast: Ag $29.73/tr oz, Au $2,646/tr oz, Cu $4.34/lb, Pb $0.92/lb, Zn $1.21/lb. Metallurgical recovery assumption: 88.3% for Ag, 88.5% for Au, 75.5% for Cu, 83% for Pb, 75% for Zn.
Promontorio Sur Vein Zone
South of the Promontorio mine, quartz-calcite veinlets with anomalous values of silver and copper cut andesitic volcanic rocks and can be traced for more than 1 km. Previous drilling reported high grades in the northern part of the Promontorio Sur vein zone adjacent to the NW-trending fault that separates it from the Promontorio zone in fault-controlled veining as well as in carbonate-replacement in limestone beneath the volcanics (see news releases dated August 22, 2019; September 24, 2024; February 13 and 27, 2025).
Step-out drilling about 200 m to the south of the NW-trending fault in Hole AL26-248 intersected 0.45 m of 386 g/t AgEq (177 g/t Ag, 0.86 g/t Au, 1.18% Cu, 0.30% Pb, 1.04% Zn) within a 6 m-wide vein zone (Table 2, Figure 2). Drilling continues at Promontorio Sur with assays pending.
| Hole | From (m) | To (m) | Interval (m) | True Width (m) |
Ag g/t | Au g/t | Cu % | Pb % | Zn % | AgEq g/t |
|---|---|---|---|---|---|---|---|---|---|---|
| AL26-248 | 83.50 | 85.60 | 2.10 | 1.90 | 41 | 0.51 | 0.28 | 0.17 | 0.30 | 121 |
| including | 83.50 | 83.95 | 0.45 | 0.40 | 177 | 0.86 | 1.18 | 0.30 | 1.04 | 386 |
| and | 85.10 | 85.60 | 0.50 | 0.45 | 2 | 0.93 | 0.04 | 0.33 | 0.26 | 101 |
True widths are based on current interpretation of mineralized structures. Weight-averaged silver-equivalent grades (AgEq g/t) are based on the October 1, 2025 Long-term CIBC Global Mining Group Analyst Consensus Commodity Price Forecast: Ag $29.73/tr oz, Au $2,646/tr oz, Cu $4.34/lb, Pb $0.92/lb, Zn $1.21/lb. Metallurgical recovery assumption: 88.3% for Ag, 88.5% for Au, 75.5% for Cu, 83% for Pb, 75% for Zn.
Europa – Europa Sur Vein Zones
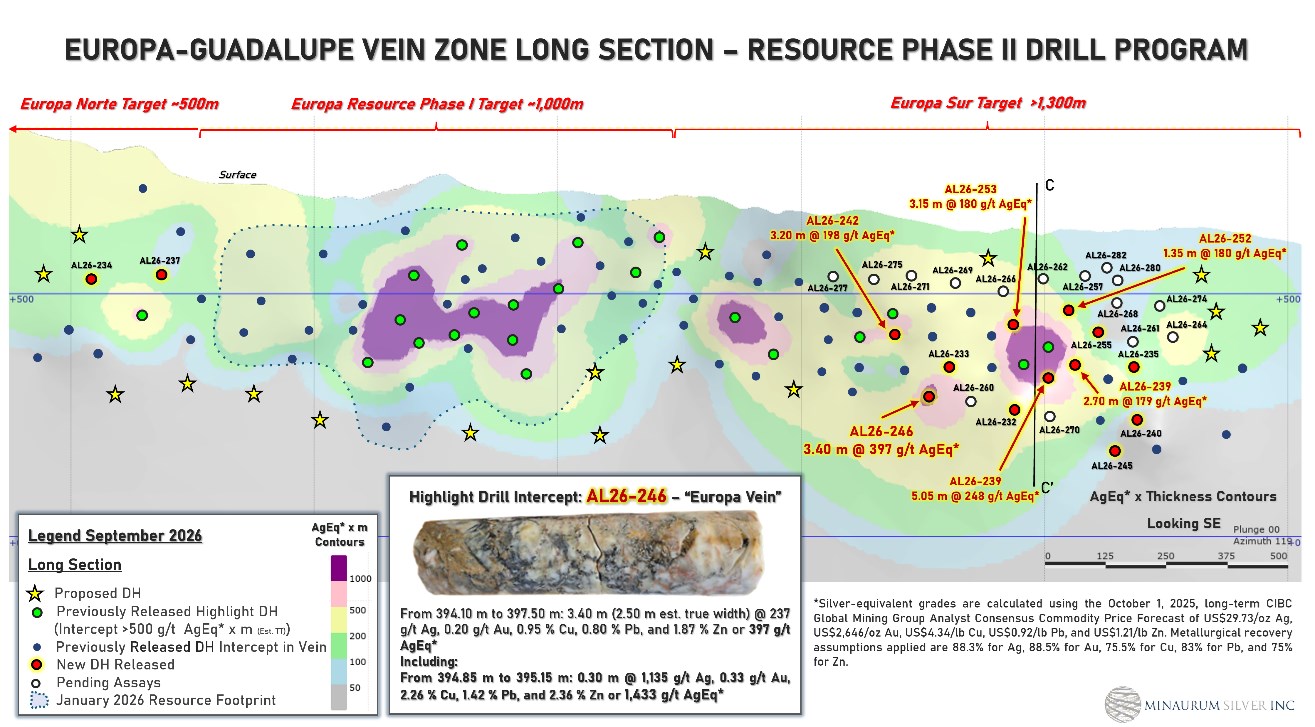
Europa Sur was not included in Minaurum’s initial resource (see news release dated January 28, 2026). Recent drilling at Europa Sur includes holes designed to intersect the upper 150–200 metres (from surface) of the structure.
Drill results to date from Europa Sur, including those in this news release, show significant potential for resource expansion outside of the central Europa vein zone (see news releases dated March 31, May 27, and July 8, 2026). Furthermore, the zone is distinct from the central part of the Europa zone for its locally higher grades of gold and copper (see news release dated May 27, 2026).
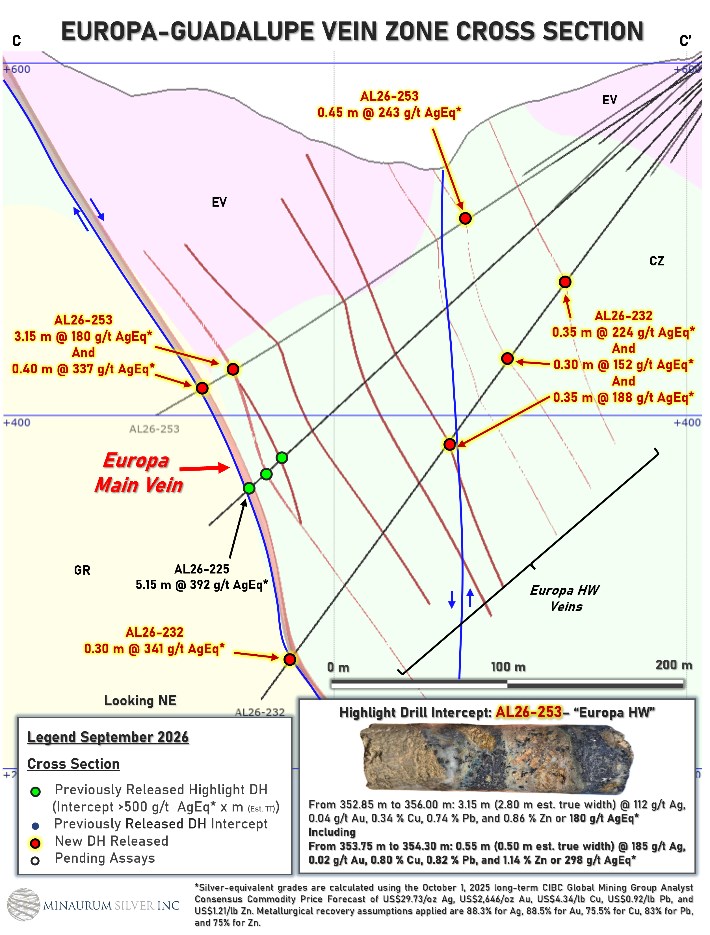
Several high-grade silver, gold and copper intercepts were returned in addition to the headline holes AL26-233 (0.40 m of 409 g/t Ag, 1.51 g/t Au, 1.27% Cu) and AL26-246 (0.30 m of 1,135 g/t Ag, 0.23 g/t Au, 2.26% Cu). AL26-253 intersected a 3.15 m interval of mineralization including 0.55 m of 298 g/t AgEq (185 g/t Ag, 0.02 g/t Au, 0.80% Cu, 0.82% Pb, 1.14% Zn). Hole AL26-232 intersected 1.80 m of mineralization which included 0.30 m of 341 g/t AgEq (261 g/t Ag, 0.01 g/t Au, 0.80% Cu, 0.31% Pb, 0.18% Zn) (Table 3, Figures 5 and 6).
Both are step-out holes approximately 80 m below and above, respectively, intersecting the pinch of the vein as indicated by the previously drilled higher grade intercept in hole AL26-225 returning 5.15 m of 392 g/t AgEq (198 g/t Ag, 0.27 g/t Au, 1.10% Cu, 1.69% Pb, 1.75% Zn) (see news release dated August 25, 2026).
Hole AL26-239 cut 2.70 m of 179 g/t AgEq (79 g/t Ag, 0.36 g/t Au, 0.27% Cu, 0.57% Pb, 1.40% Zn) including 0.30 m of 734 g/t AgEq (343 g/t Ag, 1.31 g/t Au, 1.58% Cu, 1.28% Pb, 4.80% Zn), demonstrating the potential for additional high-grade gold and copper.
| Hole | From (m) | To (m) | Interval (m) | True Width (m) |
Ag g/t | Au g/t | Cu % | Pb % | Zn % | AgEq g/t |
|---|---|---|---|---|---|---|---|---|---|---|
| AL26-232 | 173.30 | 173.65 | 0.35 | 0.32 | 162 | 0.05 | 0.36 | 0.45 | 0.75 | 224 |
| 439.45 | 441.25 | 1.80 | 1.62 | 87 | 0.00 | 0.38 | 0.32 | 0.29 | 133 | |
| including | 439.45 | 439.75 | 0.30 | 0.27 | 261 | 0.01 | 0.80 | 0.31 | 0.18 | 341 |
| and | 440.65 | 441.25 | 0.60 | 0.54 | 88 | 0.01 | 0.50 | 0.44 | 0.42 | 150 |
| 444.60 | 444.90 | 0.30 | 0.27 | 190 | 0.01 | 0.37 | 1.07 | 0.24 | 249 | |
| AL26-233 | 135.20 | 136.80 | 1.60 | 1.36 | 314 | 0.41 | 0.42 | 0.41 | 0.77 | 412 |
| including | 135.20 | 135.60 | 0.40 | 0.34 | 409 | 1.51 | 1.27 | 0.82 | 1.66 | 708 |
| 170.95 | 171.40 | 0.45 | 0.40 | 274 | 0.06 | 0.43 | 0.29 | 0.57 | 335 | |
| 176.80 | 177.70 | 0.90 | 0.75 | 144 | 0.02 | 0.20 | 0.21 | 0.43 | 177 | |
| including | 177.40 | 177.70 | 0.30 | 0.25 | 340 | 0.04 | 0.38 | 0.49 | 1.00 | 409 |
| 238.75 | 239.05 | 0.30 | 0.25 | 444 | 0.08 | 0.76 | 0.45 | 0.12 | 528 | |
| 283.20 | 283.50 | 0.30 | 0.25 | 620 | 0.07 | 0.52 | 0.58 | 0.17 | 686 | |
| 289.90 | 290.20 | 0.30 | 0.25 | 166 | 0.05 | 0.19 | 0.21 | 0.14 | 194 | |
| 309.05 | 309.35 | 0.30 | 0.25 | 471 | 0.13 | 0.63 | 0.97 | 0.44 | 566 | |
| AL26-234 | 458.65 | 459.35 | 0.70 | 0.65 | 114 | 0.01 | 0.13 | 0.12 | 0.54 | 141 |
| AL26-235 | 264.10 | 264.40 | 0.30 | 0.28 | 141 | 0.05 | 0.53 | 0.32 | 1.19 | 226 |
| AL26-237 | 413.85 | 414.15 | 0.30 | 0.28 | 143 | 0.01 | 0.27 | 0.13 | 0.15 | 173 |
| AL26-239 | 257.35 | 257.65 | 0.30 | 0.25 | 801 | 0.18 | 0.39 | 0.39 | 0.79 | 877 |
| 268.40 | 269.00 | 0.60 | 0.50 | 547 | 0.12 | 0.81 | 0.57 | 0.31 | 646 | |
| 412.60 | 415.30 | 2.70 | 2.30 | 79 | 0.36 | 0.27 | 0.57 | 1.40 | 179 | |
| including | 412.60 | 413.80 | 1.20 | 1.05 | 134 | 0.68 | 0.56 | 0.97 | 2.44 | 320 |
| which includes | 412.90 | 413.20 | 0.30 | 0.25 | 343 | 1.31 | 1.58 | 1.28 | 4.80 | 734 |
| 418.30 | 418.90 | 0.60 | 0.50 | 400 | 0.33 | 0.24 | 0.63 | 1.43 | 496 | |
| AL26-240 | 459.40 | 459.70 | 0.30 | 0.25 | 57.8 | 0.03 | 0.09 | 1.00 | 2.41 | 145 |
| AL26-242 | 295.00 | 298.20 | 3.20 | 2.75 | 159 | 0.07 | 0.15 | 0.29 | 0.61 | 198 |
| including | 296.45 | 298.20 | 1.75 | 1.50 | 231 | 0.11 | 0.18 | 0.43 | 0.89 | 286 |
| which includes | 297.70 | 298.20 | 0.50 | 0.43 | 355 | 0.16 | 0.16 | 0.46 | 0.62 | 406 |
| AL26-245 | 289.95 | 290.50 | 0.55 | 0.45 | 99 | 0.02 | 0.25 | 0.39 | 1.84 | 174 |
| AL26-246 | 143.05 | 144.80 | 1.75 | 1.25 | 180 | 0.03 | 0.22 | 0.40 | 0.60 | 223 |
| including | 143.05 | 143.45 | 0.40 | 0.30 | 303 | 0.05 | 0.35 | 0.50 | 1.20 | 375 |
| 394.10 | 397.50 | 3.40 | 2.50 | 237 | 0.20 | 0.95 | 0.80 | 1.87 | 397 | |
| including | 394.85 | 395.15 | 0.30 | 0.20 | 1,135 | 0.23 | 2.26 | 1.42 | 2.36 | 1,433 |
| and | 396.20 | 397.50 | 1.30 | 1.00 | 262 | 0.33 | 1.63 | 1.43 | 3.02 | 530 |
| AL26-247 | 160.85 | 161.15 | 0.30 | 0.28 | 120 | 0.03 | 0.18 | 0.30 | 0.64 | 160 |
| 211.10 | 211.75 | 0.65 | 0.60 | 621 | 0.18 | 0.92 | 1.63 | 3.72 | 837 | |
| 296.20 | 297.70 | 1.50 | 1.35 | 223 | 0.01 | 0.14 | 0.16 | 0.16 | 243 | |
| including | 296.20 | 296.60 | 0.40 | 0.35 | 443 | 0.02 | 0.25 | 0.16 | 0.06 | 471 |
| 342.05 | 342.40 | 0.35 | 0.30 | 284 | 0.01 | 0.30 | 0.62 | 1.59 | 361 | |
| 385.20 | 386.00 | 0.80 | 0.75 | 375 | 0.09 | 0.78 | 0.25 | 0.95 | 477 | |
| including | 385.65 | 386.00 | 0.35 | 0.32 | 752 | 0.18 | 1.56 | 0.42 | 1.80 | 952 |
| 411.00 | 416.05 | 5.05 | 4.55 | 181 | 0.03 | 0.35 | 0.57 | 1.00 | 248 | |
| including | 412.30 | 414.00 | 1.70 | 1.55 | 336 | 0.04 | 0.69 | 0.80 | 2.06 | 464 |
| and | 415.55 | 416.05 | 0.50 | 0.45 | 311 | 0.06 | 0.47 | 1.24 | 0.37 | 390 |
| AL26-252 | 135.80 | 137.15 | 1.35 | 0.95 | 84 | 0.30 | 0.31 | 0.50 | 1.23 | 176 |
| AL26-253 | 352.85 | 356.00 | 3.15 | 2.80 | 112 | 0.04 | 0.34 | 0.74 | 0.86 | 180 |
| including | 353.75 | 354.30 | 0.55 | 0.50 | 185 | 0.02 | 0.80 | 0.82 | 1.14 | 298 |
| and | 355.70 | 356.00 | 0.30 | 0.27 | 104 | 0.27 | 0.45 | 4.20 | 3.05 | 324 |
| 371.80 | 373.70 | 1.90 | 1.70 | 75 | 0.06 | 0.47 | 0.41 | 0.29 | 136 | |
| including | 373.30 | 373.70 | 0.40 | 0.37 | 184 | 0.11 | 1.32 | 0.66 | 0.72 | 337 |
| AL26-255 | 167.65 | 168.60 | 0.95 | 0.75 | 235 | 0.00 | 0.20 | 0.11 | 0.07 | 256 |
| including | 167.65 | 168.10 | 0.45 | 0.35 | 374 | 0.00 | 0.30 | 0.18 | 0.10 | 406 |
True widths are based on current interpretation of mineralized structures. Weight-averaged silver-equivalent grades (AgEq g/t) are based on the October 1, 2025 Long-term CIBC Global Mining Group Analyst Consensus Commodity Price Forecast: Ag $29.73/tr oz, Au $2,646/tr oz, Cu $4.34/lb, Pb $0.92/lb, Zn $1.21/lb. Metallurgical recovery assumption: 88.3% for Ag, 88.5% for Au, 75.5% for Cu, 83% for Pb, 75% for Zn.
San Jose Vein Zone
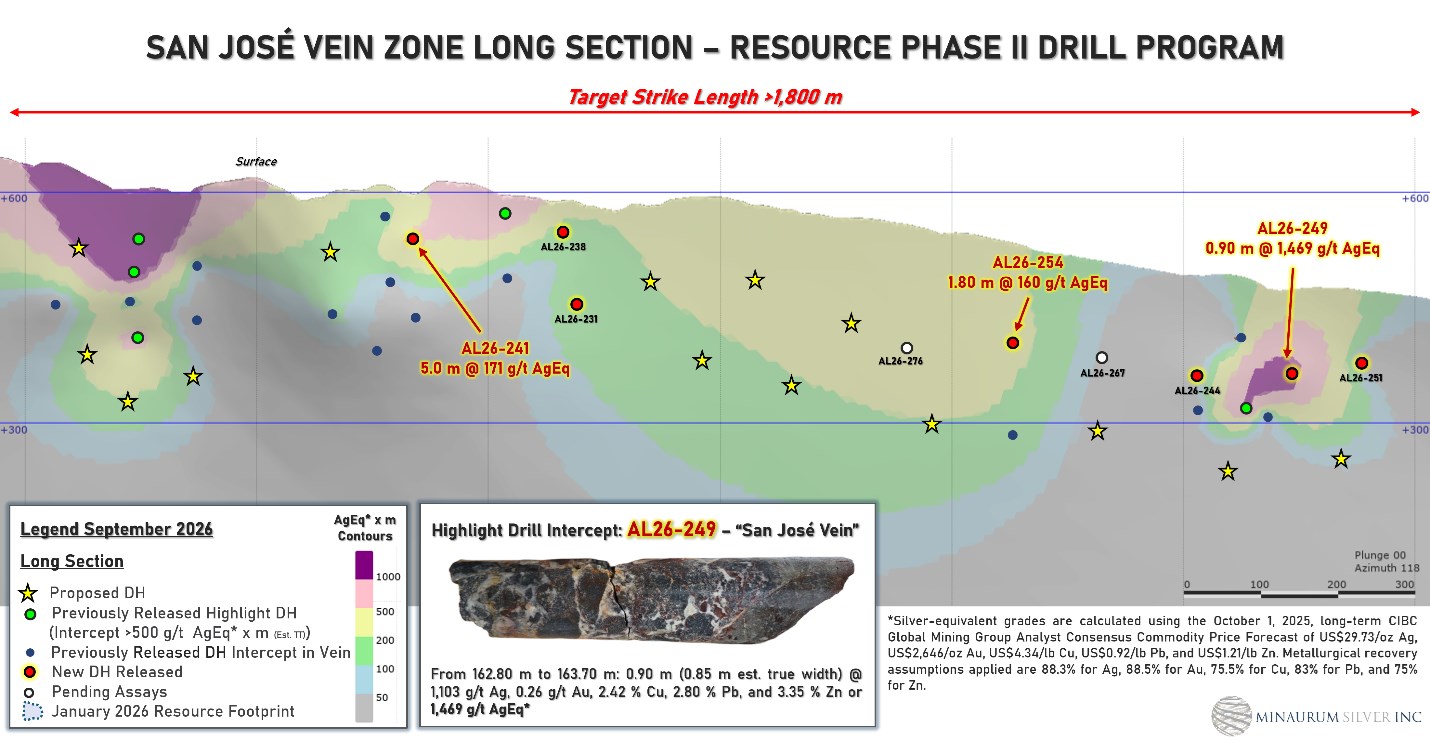
Hole AL26-249 demonstrated the high-grade potential of the San Jose vein zone, intersecting 0.90 m of 1,469 g/t AgEq (1,103 g/t Ag, 0.26 g/t Au, 2.42% Cu, 2.80% Pb, 3.35% Zn), including 0.50 m of 2,425 g/t AgEq (1,910 g/t Ag, 0.43 g/t Au, 3.90% Cu, 1.59% Pb, 4.71% Zn) (Table 4, Figure 7).
| Hole | From (m) | To (m) | Interval (m) | True Width (m) |
Ag g/t | Au g/t | Cu % | Pb % | Zn % | AgEq g/t |
|---|---|---|---|---|---|---|---|---|---|---|
| AL26-231 | 310.40 | 311.50 | 1.10 | 0.95 | 74 | 0.03 | 0.34 | 0.12 | 0.03 | 109 |
| AL26-238 | 150.15 | 150.75 | 0.60 | 0.56 | 93.4 | 0.00 | 0.10 | 0.07 | 0.08 | 106 |
| AL26-241 | 210.50 | 215.50 | 5.00 | 4.00 | 142 | 0.02 | 0.16 | 0.39 | 0.26 | 171 |
| including | 211.10 | 211.50 | 0.40 | 0.33 | 284 | 0.02 | 0.51 | 0.50 | 0.15 | 343 |
| AL26-244 | 191.65 | 192.00 | 0.35 | 0.30 | 68.3 | 0.02 | 0.06 | 0.10 | 0.04 | 79 |
| AL26-249 | 162.80 | 163.70 | 0.90 | 0.85 | 1,103 | 0.26 | 2.42 | 2.80 | 3.35 | 1,469 |
| including | 163.20 | 163.70 | 0.50 | 0.48 | 1,910 | 0.43 | 3.90 | 1.59 | 4.71 | 2,425 |
| AL26-251 | 146.90 | 147.55 | 0.65 | 0.50 | 18 | 0.00 | 0.14 | 0.00 | 0.01 | 30 |
| AL26-254 | 162.45 | 163.20 | 0.75 | 0.68 | 133 | 0.02 | 0.36 | 0.03 | 0.07 | 167 |
| 275.65 | 277.45 | 1.80 | 1.65 | 83 | 0.01 | 0.06 | 2.18 | 1.15 | 160 | |
| including | 275.65 | 276.10 | 0.45 | 0.40 | 165 | 0.03 | 0.05 | 3.58 | 0.91 | 265 |
True widths are based on current interpretation of mineralized structures. Weight-averaged silver-equivalent grades (AgEq g/t) are based on the October 1, 2025 Long-term CIBC Global Mining Group Analyst Consensus Commodity Price Forecast: Ag $29.73/tr oz, Au $2,646/tr oz, Cu $4.34/lb, Pb $0.92/lb, Zn $1.21/lb. Metallurgical recovery assumption: 88.3% for Ag, 88.5% for Au, 75.5% for Cu, 83% for Pb, 75% for Zn.
Follow Us and Stay Updated
YouTube: @MinaurumSilver • X: @MinaurumSilver • LinkedIn: Minaurum Silver Inc. • Facebook: Minaurum Silver Inc.
Subscribe to the Company’s email list at www.minaurum.com
About Minaurum Silver Inc.
Minaurum Silver Inc. (TSXV: MGG) (OTCQX: MMRGF) (FSE: 78M0) is an Americas-focused explorer concentrating on the high-grade 100% owned, production-permitted Alamos silver project in southern Sonora, Mexico and the Lone Mountain CRD Project in Nevada, USA. Minaurum is managed by one of the strongest technical and finance teams and will continue its founders’ legacy of creating shareholder value by acquiring and developing a pipeline of Tier-One precious- and base-metal projects.
ON BEHALF OF THE BOARD
“Darrell A. Rader”
Darrell A. Rader
President and CEO
For more information, please contact:
Sunny Pannu – Investor Relations and Corporate Development Manager
1570 – 200 Burrard Street, Vancouver, BC V6C 3L6
Telephone: 1 778 330-0994
www.minaurum.com | info@minaurum.com
The TSX Venture Exchange does not accept responsibility for the adequacy or accuracy of this news release.
Data review and verification: Stephen R. Maynard, Vice President of Exploration of Minaurum and a Qualified Person (QP) as defined by National Instrument 43-101, reviewed and verified the assay data, and has approved the disclosure in this news release. Verification was done by visual inspection of core samples and comparison to assay results. Assay results have not been checked by re-analysis. No factors were identified that could materially affect the accuracy or reliability of the data presented in this news release.
Analytical Procedures and Quality Assurance/Quality Control: Preparation and assaying of drilling samples from Minaurum’s Alamos project are done with strict adherence to a Quality Assurance/Quality Control (QA/QC) protocol. Core samples are sawed in half and then bagged in a secure facility near the site and then shipped either by a licensed courier by Company personnel to ALS Minerals’ preparation facility in Hermosillo, Sonora, Mexico. ALS prepares the samples, crushing them to 70% less than 2mm, splitting off 250g, and pulverizing the split to more than 85% passing 75 microns. The resulting sample pulps are prepared in Hermosillo and then shipped to Vancouver for chemical analysis by ALS Minerals. In Vancouver, the pulps are analyzed for gold by fire assay and ICP/AES on a 30-gram charge. In addition, analyses are done for silver, copper, lead, and zinc using 4-acid digestion and ICP analysis. Samples with silver values greater than 100 g/t; and copper, lead, or zinc values greater than 10,000 ppm (1%) are re-analyzed using 4-acid digestion and atomic absorption spectrometry (AAS).
Quality-control (QC) samples are inserted in the sample stream every 20 samples on average, and thus represent 5% of the total samples. QC samples include standards, blanks, and duplicate samples. Standards are pulps that have been prepared by a third-party laboratory; they have gold, silver, and base-metal values that are established by an extensive analytical process in which several commercial labs (including ALS Minerals) participate. Standards test the calibration of the analytical equipment. Blanks are rock material known from prior sampling to contain less than 0.005 ppm gold; they test the sample preparation procedure for cross-sample contamination. In the case of duplicates, the sample interval is cut in half and then quartered. The first quarter is the original sample, the second becomes the duplicate. Duplicate samples provide a test of the reproducibility of assays in the same drilled interval. When final assays are received, QC sample results are inspected for deviation from accepted values. To date, QC sample analytical results have fallen in acceptable ranges on the Alamos project.
When final assays are received, QC sample results are inspected for deviation from accepted values by the QP. To date, QC sample analytical results have fallen in acceptable ranges on the Alamos project. ALS Minerals is independent of Minaurum Silver and is independent of the Qualified Person.
Cautionary Note Regarding Forward Looking Information: This news release contains “forward-looking information” within the meaning of applicable Canadian securities legislation. “Forward-looking information” includes, but is not limited to, statements with respect to the activities, events or developments that the Company expects or anticipates will or may occur in the future, including the Resource Estimate; the ongoing Phase II 50,000 m resource expansion drill program; and the completion of an updated resource estimate in the second half of 2026. Generally, but not always, forward-looking information and statements can be identified by the use of words such as “plans”, “expects”, “is expected”, “budget”, “scheduled”, “estimates”, “forecasts”, “intends”, “anticipates”, or “believes” or the negative connotation thereof or variations of such words and phrases or state that certain actions, events or results “may”, “could”, “would”, “might” or “will be taken”, “occur” or “be achieved” or the negative connotation thereof.
In making the forward-looking information in this release, Minaurum has applied certain factors and assumptions that are based on Minaurum’s current beliefs as well as assumptions made by and information currently available to Minaurum, including that Minaurum will be able to obtain all necessary permits and approvals for planned exploration and drilling activities; that Minaurum’s planned drilling and exploration activities will be completed on the expected timeline, or at all; that the results of the drilling and exploration activities will be as expected; that Minaurum will be able to complete the updated mineral resource estimate on the timelines expected, or at all; and that Minaurum will have the financial resources to complete its ongoing drill program and anticipated updated mineral resource estimate. Although Minaurum considers these assumptions to be reasonable based on information currently available to it, they may prove to be incorrect, and the forward-looking information in this release are subject to numerous risks, uncertainties and other factors that may cause future results to differ materially from those expressed or implied in such forward-looking information.
In making the forward-looking information in this release, Minaurum has applied certain factors and assumptions that are based on Minaurum’s current beliefs as well as assumptions made by and information currently available to Minaurum. Although Minaurum considers these assumptions to be reasonable based on information currently available to it, they may prove to be incorrect, and the forward-looking information in this release are subject to numerous risks, uncertainties and other factors that may cause future results to differ materially from those expressed or implied in such forward-looking information, including risks relating to the actual results of drilling or exploration activities, fluctuating silver prices, possibility of equipment breakdowns and delays, drilling or exploration cost overruns, availability of capital and financing, general economic, market or business conditions, regulatory changes and timeliness of government or regulatory approvals.
Readers are cautioned not to place undue reliance on forward-looking information. Minaurum does not intend, and expressly disclaims any intention or obligation to, update or revise any forward-looking information whether as a result of new information, future events or otherwise, except as required by law.
Source: Minaurum Silver Inc.