SAGA Reports 3 New Top 12 Best Drill Holes in History
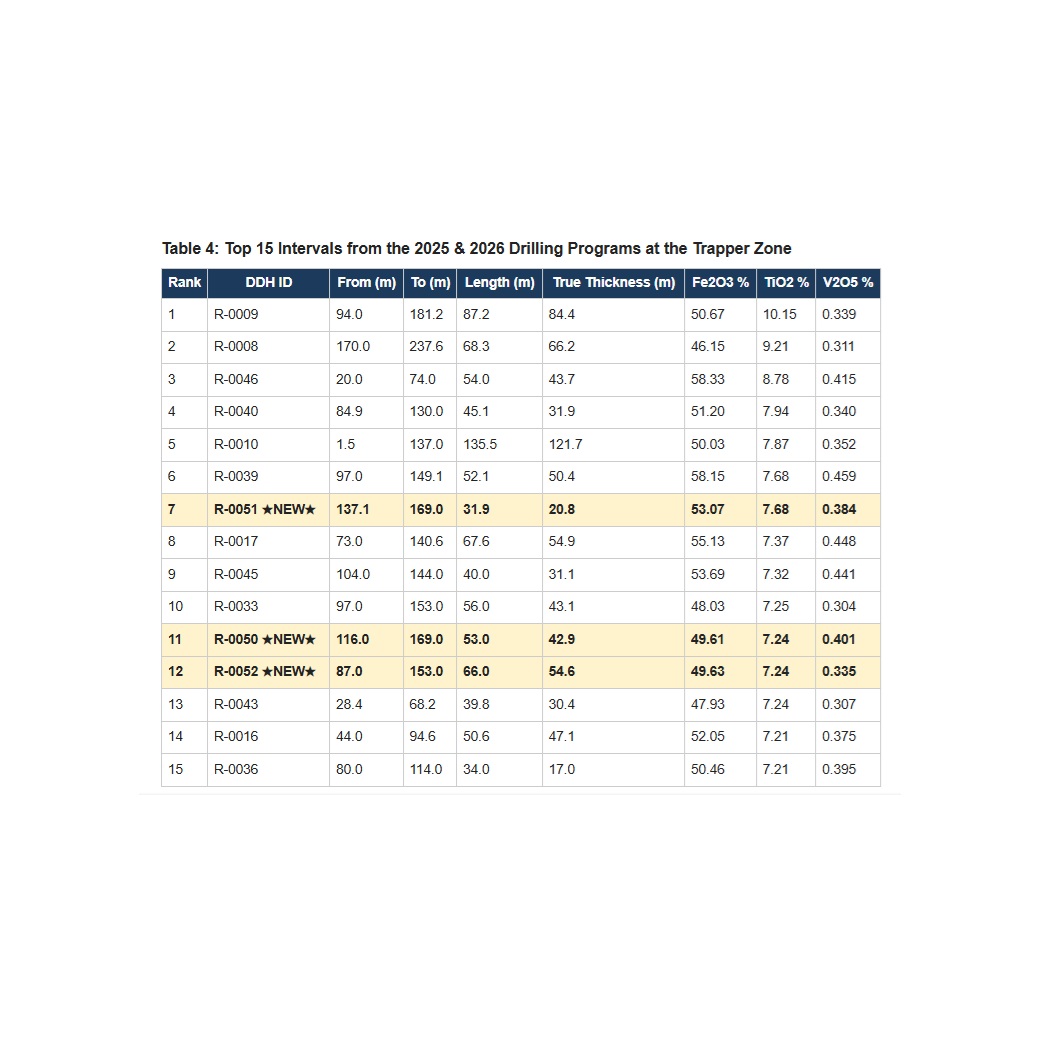
🚨 Why Today’s News Matters: 3 of 5 New Holes Rank Among SAGA’s Top 12 Best Ever Drilled
SAGA Metals just released assays for drill holes R-0050 through R-0054 at the Trapper South zone of its Radar Critical Minerals Project in Labrador. Buried in the data is a standout fact: when ranked against every one of the 67 diamond drill holes reported to date in the MRE program, three of these five new holes (R-0050, R-0051, and R-0052) land inside the Top 12 highest-grade intervals in company history (out of the Top 15 list disclosed in Table 4 below). That means over 20% of SAGA’s best assay results ever recorded came from this single batch — a strong signal of consistency and scale ahead of the Company’s maiden Mineral Resource Estimate.
- R-0051: 31.9 m @ 53.07% Fe2O3, 7.68% TiO2, 0.384% V2O5 — ranks #7 all-time
- R-0050: 53.0 m @ 49.61% Fe2O3, 7.24% TiO2, 0.401% V2O5 — ranks #11 all-time
- R-0052: 66.0 m @ 49.63% Fe2O3, 7.24% TiO2, 0.335% V2O5 — ranks #12 all-time
Combined with a massive 159.9 m intercept in R-0053 and continued thick, high-grade oxide mineralization at depth, this news reinforces the scale and grade continuity of the Trapper Zone as SAGA advances toward its maiden resource estimate.
SAGA Metals Reports Assays from R-0050 to R-0054 with Intercepts Including 53.07% Fe2O3, 7.68% TiO2, 0.384% V2O5 from 2026 Drilling at Trapper South, Radar Critical Minerals Project in Labrador
July 22, 2026 7:30 AM EDT | Source: Saga Metals Corp.
Vancouver, British Columbia — SAGA Metals Corp. (TSXV: SAGA) (OTCQB: SAGMF) (FSE: 20H) (“SAGA” or the “Company”), a North American exploration company focused on critical mineral discoveries, is pleased to report additional assay results from drill holes R-0050, -0051, -0052, -0053 and -0054 completed in 2026 as part of its ongoing maiden Mineral Resource Estimate (“MRE”) diamond drill program at the Trapper Zone within the 100%-owned Radar Titanium-Vanadium-Iron Project near Cartwright, Labrador, Canada. The Trapper Zone forms part of an oxide corridor that includes the Falcon and Hawkeye Zones collectively covering 29 square kilometres (Figure 1).
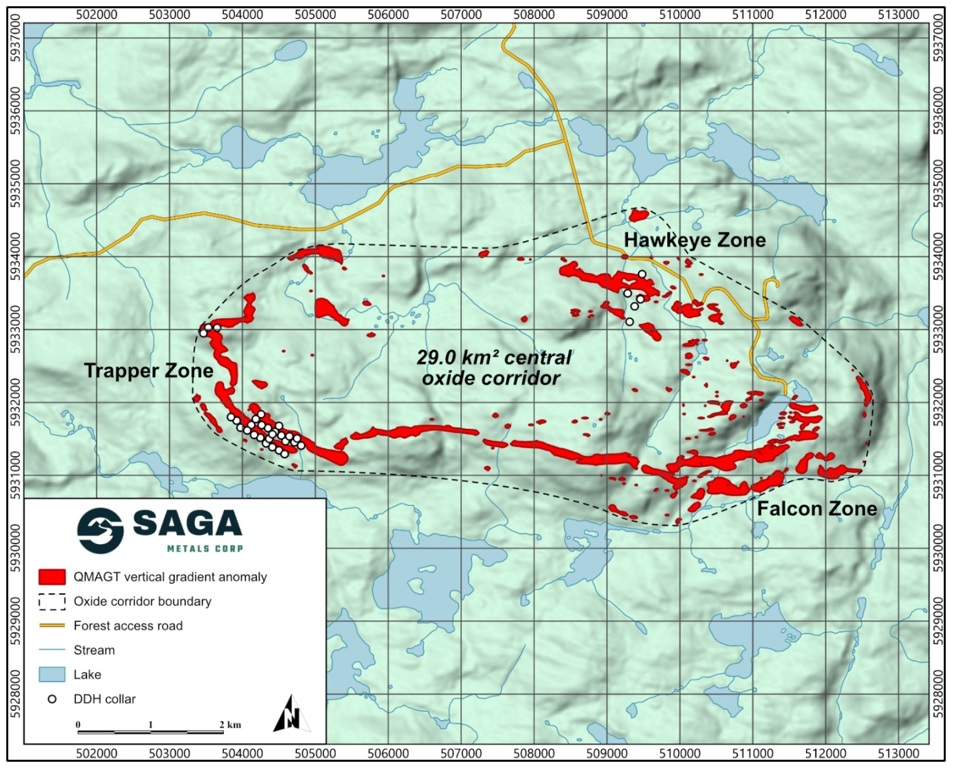
Figure 1: The Radar Property with the Dias QMAGT vertical gradient (Bzz) anomaly footprint shown in red (high-amplitude pixels only). The QMAGT-imaged central oxide-layering corridor validated over 29 km², encompassing the Trapper Zone, Hawkeye Zone, and the new Falcon Zone.
Tap image to view full size- Analytical results received for five (5) additional diamond drill holes (R-0050 to R-0054) from the MRE drill program initiated in Q4 2025, delivering consistent broad intercepts of oxide mineralization.
Key intercepts include:
- Hole R-0050: 128.1 m @ 40.80% Fe2O3, 5.79% TiO2, 0.294% V2O5
Including 53.0 m @ 49.61% Fe2O3, 7.24% TiO2, 0.401% V2O5 - Hole R-0051: 119.1 m @ 42.68% Fe2O3, 5.89% TiO2, 0.280% V2O5
Including 31.9 m @ 53.07% Fe2O3, 7.68% TiO2, 0.384% V2O5 - Hole R-0052: 112.4 m @ 46.67% Fe2O3, 6.71% TiO2, 0.305% V2O5
Including 66.0 m @ 49.63% Fe2O3, 7.24% TiO2, 0.335% V2O5 - Hole R-0053: 159.9 m @ 45.27% Fe2O3, 6.32% TiO2, 0.306% V2O5
Including 37.5 m @ 50.44% Fe2O3, 6.72% TiO2, 0.385% V2O5
Including 62.0 m @ 46.73% Fe2O3, 6.79% TiO2, 0.306% V2O5 - Hole R-0054: 57.8 m @ 44.92% Fe2O3, 6.71% TiO2, 0.275% V2O5
These results now bring the total MRE drill results to forty-seven (47) diamond drill holes received to date. As reported previously, analytical results from the first forty-two (42) diamond drill holes of the MRE drill program are shown in Table 1 below.
Table 1: MRE Drill Program Assay Intercepts Previously Reported (R-0008 to R-0049)
| DDH ID | From (m) | To (m) | Length (m) | True Thickness (m) | Fe2O3 % | TiO2 % | V2O5 % |
|---|---|---|---|---|---|---|---|
| R-0008 | 170.0 | 237.6 | 68.3 | 66.2 | 46.15 | 9.21 | 0.311 |
| R-0009 | 94.0 | 181.2 | 87.2 | 84.4 | 50.67 | 10.15 | 0.339 |
| R-0010 | 1.5 | 137.0 | 135.5 | 121.7 | 50.03 | 7.87 | 0.352 |
| R-0011 | 58.1 | 153.3 | 95.2 | 50.8 | 39.49 | 6.49 | 0.222 |
| R-0012 | 3.8 | 79.0 | 75.2 | 39.6 | 27.39 | 4.87 | 0.116 |
| R-0013 | 9.5 | 121.0 | 111.5 | 97.9 | 37.08 | 5.14 | 0.242 |
| R-0014 | 8.8 | 50.0 | 41.2 | 14.9 | 36.17 | 6.36 | 0.188 |
| R-0015 | 73.3 | 174.0 | 100.7 | 88.9 | 38.56 | 6.80 | 0.229 |
| R-0016 | 44.0 | 94.6 | 50.6 | 47.1 | 52.05 | 7.21 | 0.375 |
| R-0017 | 50.6 | 140.6 | 90.0 | 73.0 | 51.86 | 6.76 | 0.417 |
| R-0018 | 44.7 | 115.0 | 70.3 | 44.1 | 42.64 | 5.66 | 0.288 |
| R-0019 | 66.6 | 112.3 | 45.7 | 41.6 | 49.51 | 6.56 | 0.374 |
| R-0020 | 87.3 | 128.0 | 40.7 | 31.1 | 37.62 | 4.93 | 0.239 |
| R-0021 | 96.0 | 127.4 | 31.4 | 16.5 | 53.18 | 7.08 | 0.414 |
| R-0022 | 62.0 | 92.6 | 30.6 | 28.6 | 49.4 | 6.61 | 0.373 |
| R-0023 | 100.5 | 186.5 | 86.0 | 54.0 | 45.5 | 5.5 | 0.367 |
| R-0024 | 112.0 | 203.0 | 91.0 | 58.7 | 49.08 | 6.23 | 0.39 |
| R-0024 | 142.0 | 186.0 | 44.0 | 28.4 | 54.2 | 7.07 | 0.443 |
| R-0025 | 141.3 | 223.0 | 81.7 | 58.5 | 41.36 | 5.18 | 0.309 |
| R-0025 | 168.0 | 201.0 | 33.0 | 23.7 | 47.38 | 6.01 | 0.384 |
| R-0026 | 141.7 | 189.0 | 47.3 | 27.7 | 38.16 | 4.65 | 0.288 |
| R-0026 | 110.9 | 131.4 | 20.5 | 12.0 | 52.39 | 6.55 | 0.449 |
| R-0027 | 81.2 | 162.0 | 80.8 | 63.4 | 42.74 | 5.18 | 0.320 |
| R-0028 | 105.7 | 211.0 | 105.3 | 54.5 | 42.39 | 5.40 | 0.306 |
| R-0028 | 144.0 | 182.0 | 38.0 | 19.7 | 49.43 | 6.50 | 0.382 |
| R-0029 | 65.2 | 172.0 | 106.8 | 95.5 | 44.41 | 5.36 | 0.341 |
| R-0029 | 65.2 | 104.0 | 38.8 | 34.7 | 53.02 | 6.46 | 0.441 |
| R-0030 | 83.1 | 174.0 | 90.9 | 49.5 | 42.57 | 5.40 | 0.303 |
| R-0030 | 83.1 | 101.7 | 18.6 | 10.2 | 50.81 | 6.56 | 0.398 |
| R-0031 | 63.4 | 171.6 | 108.2 | 87.2 | 38.11 | 5.13 | 0.254 |
| R-0031 | 97.0 | 140.1 | 43.1 | 34.7 | 42.71 | 5.88 | 0.309 |
| R-0032 | 53.8 | 198.0 | 144.2 | 135.3 | 37.13 | 5.04 | 0.234 |
| R-0032 | 114.0 | 170.0 | 56.0 | 52.6 | 44.68 | 6.50 | 0.294 |
| R-0033 | 67.4 | 168.0 | 100.6 | 77.5 | 44.07 | 6.38 | 0.286 |
| R-0033 | 97.0 | 153.0 | 56.0 | 43.1 | 48.03 | 7.25 | 0.304 |
| R-0034 | 68.8 | 195.0 | 126.2 | 124.0 | 43.19 | 6.05 | 0.293 |
| R-0034 | 106.1 | 170.0 | 63.9 | 62.8 | 48.61 | 7.01 | 0.344 |
| R-0035 | 8.5 | 22.0 | 13.5 | 9.9 | 30.98 | 2.93 | 0.193 |
| R-0036 | 55.0 | 128.0 | 73.0 | 36.5 | 45.34 | 6.31 | 0.345 |
| R-0036 | 80.0 | 114.0 | 34.0 | 17.0 | 50.46 | 7.21 | 0.395 |
| R-0037 | 52.2 | 103.0 | 50.8 | 41.9 | 45.93 | 6.46 | 0.348 |
| R-0038 | 45.4 | 146.2 | 100.8 | 73.7 | 41.23 | 5.21 | 0.302 |
| R-0038 | 103.9 | 146.2 | 42.4 | 31.0 | 46.20 | 6.35 | 0.364 |
| R-0039 | 84.0 | 194.0 | 110.1 | 106.5 | 47.42 | 5.95 | 0.354 |
| R-0039 | 97.0 | 149.1 | 52.1 | 50.4 | 58.15 | 7.68 | 0.459 |
| R-0039 | 166.4 | 194.0 | 27.6 | 26.7 | 45.88 | 5.85 | 0.350 |
| R-0040 | 84.9 | 130.0 | 45.1 | 31.9 | 51.20 | 7.94 | 0.340 |
| R-0041 | 6.6 | 53.0 | 46.4 | 34.7 | 47.97 | 6.49 | 0.368 |
| R-0042 | 102.1 | 137.4 | 35.3 | 23.6 | 50.68 | 6.74 | 0.378 |
| R-0043 | 28.4 | 68.2 | 39.8 | 30.4 | 47.93 | 7.24 | 0.307 |
| R-0044 | 82.9 | 105.8 | 22.9 | 16.6 | 51.38 | 6.85 | 0.415 |
| R-0045 | 76.9 | 148.3 | 71.3 | 53.7 | 48.28 | 6.21 | 0.373 |
| R-0045 | 104.0 | 144.0 | 40.0 | 31.1 | 53.69 | 7.32 | 0.441 |
| R-0046 | 20.0 | 147.9 | 127.9 | 103.6 | 52.94 | 7.35 | 0.388 |
| R-0046 | 20.0 | 74.0 | 54.0 | 43.7 | 58.33 | 8.78 | 0.415 |
| R-0047 | 120.6 | 247.4 | 126.8 | 110.1 | 42.84 | 5.43 | 0.306 |
| R-0047 | 120.6 | 189.0 | 68.4 | 59.4 | 46.81 | 6.17 | 0.335 |
| R-0048 | 31.7 | 124.0 | 92.3 | 50.6 | 42.46 | 5.38 | 0.304 |
| R-0048 | 31.7 | 48.0 | 16.3 | 8.9 | 53.72 | 7.29 | 0.431 |
| R-0049 | 30.7 | 131.0 | 100.3 | 47.3 | 42.97 | 5.39 | 0.316 |
| R-0049 | 30.7 | 57.3 | 26.5 | 12.5 | 53.91 | 7.22 | 0.431 |
- Top 15 intercepts from the MRE Drill Program to date can be found in Table 4 below.
- Completed sixty-seven (67) holes (R-0008 to R-0074) from Q4 2025 to date in 2026, with significant oxide intercepts including 244.4 m from R-0061 (true thickness of 204.7 m) of semi-massive oxide with extensive rhythmic oxide layering.
- Actively drilling holes R-0075 and R-0076.
- MRE drilling to date has returned multiple holes of thick oxide core intercepts exceeding 70–144 metres and certain assay intervals frequently above 45–58% Fe2O3, 6–8% TiO2 and 0.37–0.44% V2O5.
- Rhythmic banding and semi-massive to massive oxide mineralization are observed consistently in Trapper South, comparable to the high-grade results from Trapper North.
- Drilling is progressing efficiently, with 17,448 m completed in the Trapper Zone to date.
- Excellent core recovery remains above 95% and representative sampling supports ongoing metallurgical test work and the advancement of the maiden Mineral Resource Estimate.
“The latest assay results from holes R-0050 through R-0054 continue to deliver outstanding thickness and grade continuity at Trapper South. We are particularly encouraged by multiple broad intercepts exceeding 100 metres, highlighted by a significant 159.9 m intercept in hole R-0053 grading 45.27% Fe2O3, 6.32% TiO2, and 0.306% V2O5. These consistently thick oxide zones with frequent higher-grade sub-intervals demonstrate the scale and robustness of the mineralized system and further strengthen our confidence in the upcoming maiden Mineral Resource Estimate.”
— Michael Garagan, CGO & Director of SAGA Metals
The latest results from these drill holes, R-0050, R-0051, R-0052, R-0053 and R-0054, once again demonstrate excellent continuity across broad zones of oxide mineralization, underscoring the growing potential for a sizable mineral resource that could create meaningful long-term value for SAGA shareholders.
- Hole R-0050 (Cross-Section S10, Figure 2): Drilled on pad BI-1 with an azimuth of 218° dipping -45° with a total depth of 269 m. The hole intercepts the oxide zone at 63.9 m. The oxide zone is 146.1 m and consists of 51.9 m of semi-massive oxide and 94.2 m of rhythmic layering.
- Hole R-0051 (Cross-Section S11, Figure 3): Drilled on pad AO-1 with an azimuth of 38° dipping -60° with a total depth of 311 m. The hole intercepts the oxide zone at 99.9 m. The oxide zone is 127.4 m and consists of 38.5 m of semi-massive oxide and 88.8 m of rhythmic layering.
- Hole R-0052 (Cross-Section S12, Figure 4): Drilled on pad AG-1 with an azimuth of 38° dipping -45° with a total depth of 275 m. The hole intercepts the oxide zone at 68.6 m. The oxide zone is 160.6 m and consists of 19.8 m of semi-massive oxide and 140.8 m of rhythmic layering.
- Hole R-0053 (Cross-Section S12, Figure 4): Drilled on pad AG-1 with an azimuth of 38° dipping -60° with a total depth of 299 m. The hole intercepts the oxide zone at 77.1 m. The oxide zone is 202.3 m and consists of 35.0 m of semi-massive oxide and 167.3 m of rhythmic layering.
- Hole R-0054 (Cross-Section S13, Figure 5): The first hole drilled on pad AL-1 with an azimuth of 38° dipping -45° with a total depth of 269 m. The oxide zone is 120.5 m and consists of 35.2 m of semi-massive oxide and 85.3 m of rhythmic layering.
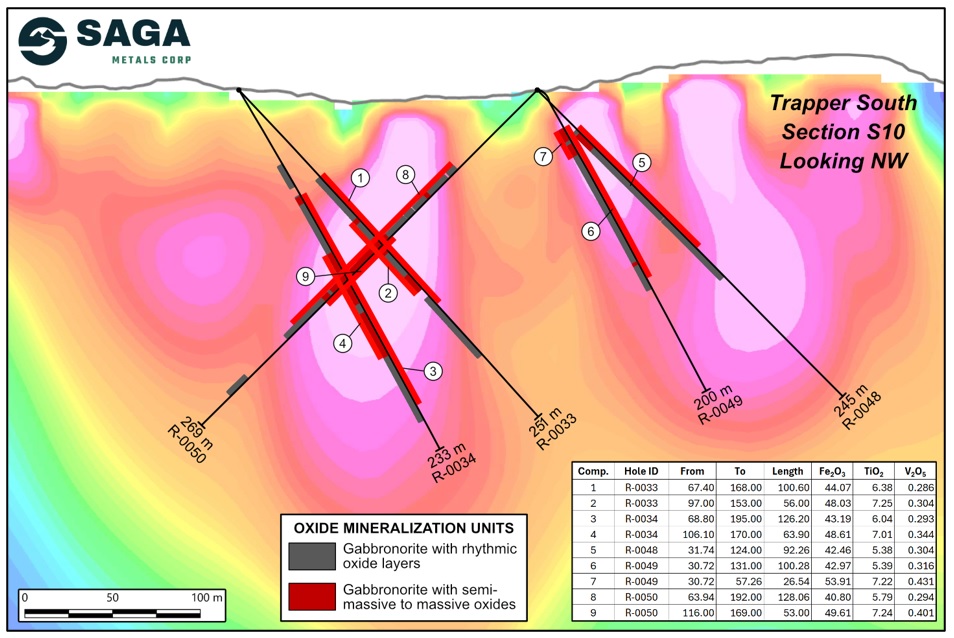
Figure 2: Cross section of S10 looking NW showing R-0033, -0034, -0048, -0049 and -0050, highlighting intercepts of semi-massive oxides and layering sequence with the 3D Magnetic Inversion of the 2025 Trapper Zone ground magnetic survey. Assays shown for R-0033, R-0034, R-0048, R-0049 and R-0050.
Tap image to view full size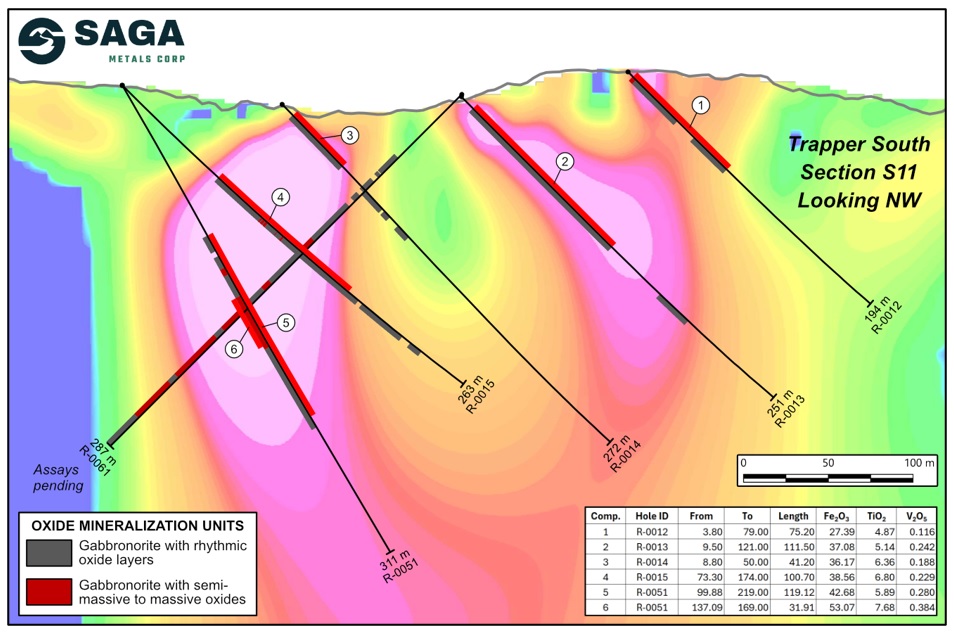
Figure 3: Cross section of S11 looking NW showing R-0012, -0013, -0014, -0015, -0051 and -0061, highlighting intercepts of semi-massive oxides and layering sequence with the 3D Magnetic Inversion of the 2025 Trapper Zone ground magnetic survey. Assays shown for R-0012, -0013, -0014, -0015, and -0051. Assays are pending for R-0061.
Tap image to view full size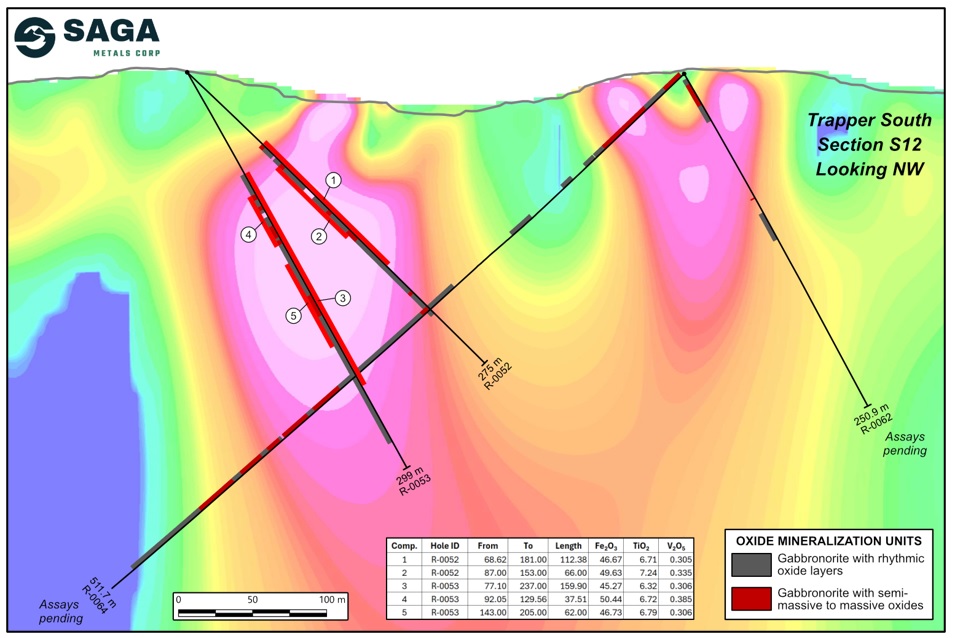
Figure 4: Cross section of S12 looking NW showing R-0052, -0053, -0062 and -0064, highlighting intercepts of semi-massive oxides and layering sequence with the 3D Magnetic Inversion of the 2025 Trapper Zone ground magnetic survey. Assays shown for R-0052 and R-0053. Assays are pending for R-0062 and R-0064.
Tap image to view full size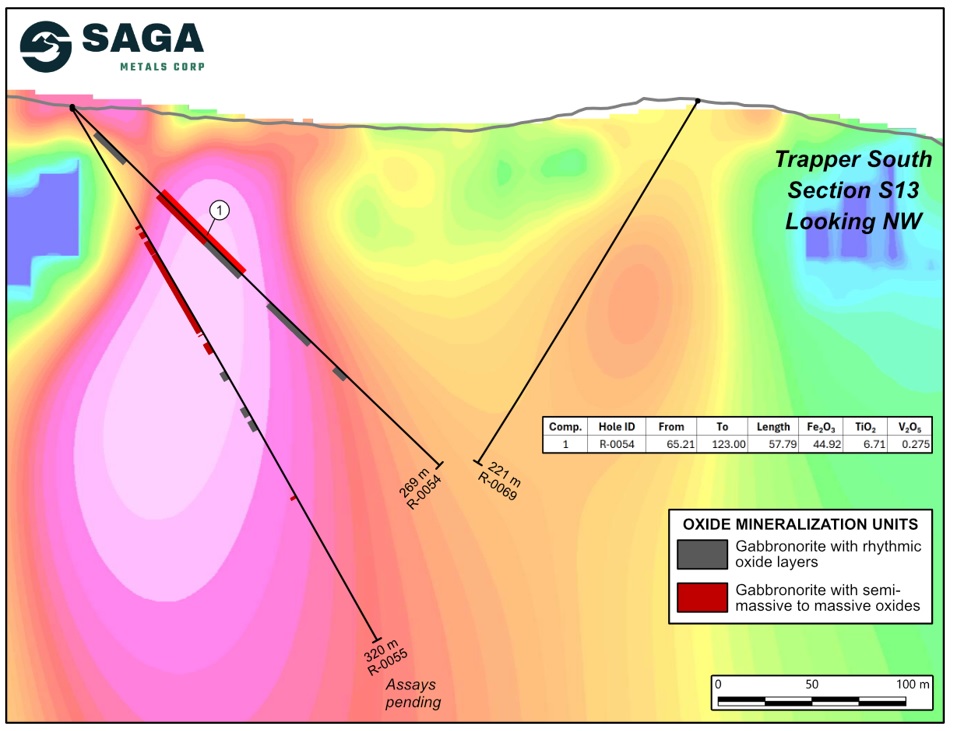
Figure 5: Cross section of S13 looking NW showing R-0054, -0055 and -0069, highlighting intercepts of semi-massive oxides and layering sequence with the 3D Magnetic Inversion of the 2025 Trapper Zone ground magnetic survey. Assays shown for R-0054. Assays pending for R-0055 and R-0069.
Tap image to view full size| Drill Hole | Azimuth/Dip | Total Depth (m) | From (m) | To (m) | Semi-Massive Oxide (m) | Rhythmic Layering (m) | Total Oxide (m) | True Thickness (m) | Assays |
|---|---|---|---|---|---|---|---|---|---|
| R-0016 | 38°/-45° | 206 | 44.0 | 102.0 | 45.8 | 12.2 | 58.0 | 53.9 | Yes |
| R-0017 | 38°/-70° | 161 | 50.6 | 140.6 | 87.1 | 3.0 | 90.1 | 73.0 | Yes |
| R-0018 | 38°/-45° | 188 | 44.7 | 156.4 | 65.0 | 46.6 | 111.7 | 70.1 | Yes |
| R-0019 | 38°/-45° | 182 | 66.6 | 133.0 | 38.0 | 28.5 | 66.5 | 72.8 | Yes |
| R-0020 | 38°/-45° | 206 | 50.8 | 138.0 | 28.5 | 58.7 | 87.2 | 66.7 | Yes |
| R-0021 | 38°/-70° | 152 | 81.3 | 127.4 | 33.5 | 12.6 | 46.1 | 24.3 | Yes |
| R-0022 | 38°/-45° | 149 | 22.5 | 118.7 | 31.6 | 59.7 | 91.3 | 85.3 | Yes |
| R-0023 | 38°/-45° | 272 | 100.5 | 239.3 | 30.6 | 76.4 | 107.1 | 67.2 | Yes |
| R-0024 | 38°/-45° | 254 | 108.9 | 219.8 | 46.8 | 62.1 | 108.9 | 68.5 | Yes |
| R-0025 | 38°/-60° | 275 | 123.0 | 253.6 | 6.9 | 118.1 | 125.0 | 89.6 | Yes |
| R-0026 | 38°/-60° | 302 | 108.8 | 273.7 | 16.2 | 138.6 | 154.8 | 87.4 | Yes |
| R-0027 | 38°/-45° | 217 | 81.3 | 175.3 | 34.2 | 59.9 | 94.1 | 73.9 | Yes |
| R-0028 | 38°/-60° | 227 | 105.1 | 215.9 | 22.5 | 87.1 | 109.6 | 57.4 | Yes |
| R-0029 | 38°/-45° | 214 | 65.2 | 184.0 | 13.4 | 105.4 | 118.8 | 106.2 | Yes |
| R-0030 | 38°/-60° | 211 | 83.1 | 189.2 | 25.4 | 79.6 | 105.0 | 57.8 | Yes |
| R-0031 | 38°/-45° | 215 | 63.4 | 171.6 | 2.4 | 105.9 | 108.3 | 87.2 | Yes |
| R-0032 | 38°/-60° | 263 | 53.8 | 214.7 | 18.5 | 136.0 | 154.4 | 145.0 | Yes |
| R-0033 | 38°/-45° | 251 | 67.7 | 203.5 | 23.7 | 112.4 | 136.1 | 104.8 | Yes |
| R-0034 | 38°/-60° | 233 | 48.7 | 214.1 | 66.1 | 93.5 | 159.7 | 156.9 | Yes |
| R-0035 | 38°/-45° | 97 | 8.5 | 66.3 | 0.0 | 35.0 | 35.0 | 25.7 | Yes |
| R-0036 | 38°/-70° | 212 | 47.4 | 128.0 | 68.0 | 8.6 | 76.6 | 38.3 | Yes |
| R-0037 | 38°/-45° | 206 | 42.6 | 146.0 | 50.8 | 52.6 | 103.4 | 85.2 | Yes |
| R-0038 | 38°/-70° | 182 | 45.4 | 146.2 | 55.9 | 45.0 | 100.9 | 73.7 | Yes |
| R-0039 | 218°/-45° | 251 | 84.0 | 196.3 | 82.2 | 23.3 | 105.5 | 102.1 | Yes |
| R-0040 | 38°/-70° | 170 | 38.3 | 130.0 | 44.7 | 28.7 | 73.4 | 34.3 | Yes |
| R-0041 | 38°/-45° | 100 | 6.6 | 84.2 | 38.5 | 30.9 | 69.4 | 52.1 | Yes |
| R-0042 | 38°/-70° | 161 | 88.6 | 137.4 | 26.6 | 10.0 | 36.6 | 24.5 | Yes |
| R-0043 | 38°/-45° | 119 | 28.4 | 101.6 | 37.5 | 35.7 | 73.3 | 55.9 | Yes |
| R-0044 | 218°/-45° | 176 | 82.9 | 105.8 | 19.3 | 3.7 | 22.9 | 16.6 | Yes |
| R-0045 | 218°/-45° | 245 | 39.3 | 223.6 | 67.4 | 71.7 | 139.1 | 96.9 | Yes |
| R-0046a | 218°/-45° | 491 | 7.4 | 147.9 | 121.7 | 19.3 | 141.0 | 108.0 | Yes |
| R-0046b | — | — | 237.7 | 445.9 | 21.4 | 176.7 | 198.2 | 113.7 | Yes |
| R-0047 | 218°/-45° | 305 | 106.1 | 247.4 | 50.8 | 71.5 | 122.3 | 118.1 | Yes |
| R-0048 | 38°/-45° | 242 | 31.7 | 149.3 | 11.8 | 105.1 | 116.9 | 109.9 | Yes |
| R-0049 | 38°/-60° | 200 | 30.7 | 134.3 | 17.4 | 86.1 | 103.6 | 66.6 | Yes |
| R-0050 ★NEW★ | 218°/-45° | 269 | 63.9 | 245.6 | 51.9 | 94.2 | 146.1 | 103.3 | Yes |
| R-0051 ★NEW★ | 38°/-60° | 311 | 99.9 | 227.3 | 38.5 | 88.8 | 127.4 | 83.0 | Yes |
| R-0052 ★NEW★ | 38°/-45° | 275 | 68.6 | 235.0 | 19.8 | 140.8 | 160.6 | 134.7 | Yes |
| R-0053 | 38°/-60° | 299 | 77.1 | 279.4 | 35.0 | 167.3 | 202.3 | 132.1 | Yes |
| R-0054 | 38°/-45° | 269 | 18.4 | 202.0 | 35.2 | 85.3 | 120.5 | 97.7 | Yes |
| R-0055 | 38°/-60° | 320 | 70.1 | 291.6 | 67.6 | 73.2 | 140.8 | 82.3 | Pending |
| R-0056 | 38°/-45° | 239 | 84.8 | 220.0 | 24.4 | 69.6 | 94.0 | 56.1 | Pending |
| R-0057 | 38°/-60° | 233 | 92.4 | 194.1 | 43.6 | 52.5 | 96.1 | 83.4 | Pending |
| R-0058 | 38°/-45° | 299 | 71.6 | 138.9 | 0.0 | 53.0 | 53.0 | 36.2 | Pending |
| R-0059 | 38°/-45° | 377 | 81.9 | 374.9 | 6.2 | 179.6 | 185.7 | 155.2 | Pending |
| R-0060 | 38°/-60° | 335 | 80.9 | 243.4 | 88.9 | 72.0 | 160.9 | 151.5 | Pending |
| R-0061 | 218°/-45° | 359 | 51.9 | 307.3 | 93.5 | 150.8 | 244.4 | 223.2 | Pending |
| R-0062 | 38°/-60° | 251 | 0.0 | 125.6 | 36.2 | 75.2 | 111.4 | 101.8 | Pending |
| R-0063 | 180°/-45° | 542 | 61.7 | 494.0 | 6.5 | 131.3 | 137.8 | 79.0 | Pending |
| R-0064 | 218°/-45° | 569 | 2.0 | 492.5 | 160.1 | 236.5 | 396.6 | 340.0 | Pending |
| R-0065a | 218°/-45° | 584 | 41.1 | 162.7 | 4.2 | 117.4 | 121.7 | 117.6 | Pending |
| R-0065b | — | — | 338.7 | 584.0 | 61.3 | 172.1 | 233.4 | 191.2 | Pending |
| R-0066a | 218°/-45° | 320 | 52.2 | 98.5 | 32.1 | 0.0 | 32.1 | 32.1 | Pending |
| R-0066b | — | — | 169.7 | 298.9 | 0.0 | 93.7 | 93.7 | 93.3 | Pending |
| R-0067a | 38°/-45° | 221 | 13.8 | 33.0 | 0.0 | 19.2 | 19.2 | Pending | Pending |
| R-0067b | — | — | 48.5 | 124.3 | 19.2 | 55.6 | 74.8 | Pending | Pending |
| R-0068 | 38°/-65° | 260 | 31.5 | 72.2 | 24.6 | 9.9 | 34.6 | Pending | Pending |
| R-0069 | 218°/-60° | 221 | 105.7 | 122.2 | 0.0 | 16.5 | 16.5 | Pending | Pending |
| R-0070 | 38°/-45° | 221 | Logging in progress | ||||||
| R-0071 | 38°/-45° | 242 | 59.4 | 186.6 | 46.4 | 55.2 | 101.6 | Pending | Pending |
| R-0072 | 38°/-70° | 473 | Logging in progress | ||||||
| R-0073 | 38°/-65° | 242 | Logging in progress | ||||||
| R-0074 | 218°/-55° | 332 | Logging in progress | ||||||
| R-0075 | 38°/-55° | Drilling in progress | |||||||
| R-0076 | 38°/-45° | Drilling in progress | |||||||
| Total (m) | 15,398 | ||||||||
Table 2: Summary of drill holes R-0016 to R-0076, highlighting the oxide intercepts. True thickness represents the perpendicular width of the mineralized zone, while total downhole oxide represents the length of mineralization intercepted downhole. Highlighted rows are the newly reported holes in this release. Swipe left/right to see the full table on mobile.
Table 3: Total Meters Drilled & Samples Collected
| Total Meters Drilled | Total Samples | |
|---|---|---|
| Trapper South 2025 | 2,050 | 1,313 |
| Trapper South 2026 | 15,398 | 8,361 |
| Trapper Total | 17,448 | 9,674 |
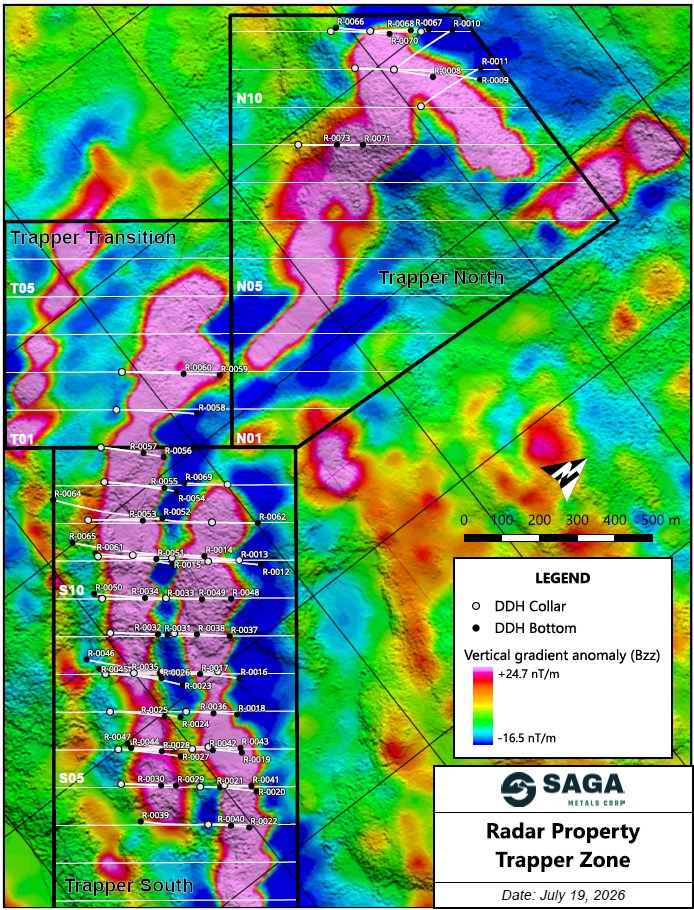
Figure 6: Trapper Zone plan view map outlining location of the MRE drill program completed to date, including cross-sections 0S4-S14 in Trapper South, T02-T03 in Trapper Transition, and N9-N12 in Trapper North showing the TMI of the 2025 Trapper Zone ground magnetic survey.
Tap image to view full sizeSaga’s core cutting team finalized the cutting, sampling, and shipping of 475 samples from R-0055, -0056, and -0057. IGS Laboratories received the samples last week and anticipates releasing the assay results to the Company in the coming days. An additional 612 samples from R-0058, -0059 and -0060 were shipped to IGS yesterday. A total of 9,674 samples have been collected in the Trapper Zone to date.
- Confirmed mineralization in 74 out of 74 drill holes completed and observed in two primary zones to date.
- Analytical results to date include numerous oxide-rich intercepts (see Table 4 below).
- Infrastructure including road access, deep-water port, nearby hydro-electric power and regional airport.
- Confirmed a 29.0 km² central oxide corridor that encompasses the Trapper, Falcon and Hawkeye Zones, demonstrating district-scale potential.
- Consistent grades and thicknesses with semi-massive to massive oxide reporting up to 72.33% Fe2O3, 13.3% TiO2, and 0.66% V2O5.
- Petrographic analysis confirms titanomagnetite mineralization is advantageous for simplified metallurgical processing.
- A total of 17,448 m has been completed and reported to date for the MRE drill program (see Figure 6 above).
Table 4: Top 15 Intervals from the 2025 & 2026 Drilling Programs at the Trapper Zone
| Rank | DDH ID | From (m) | To (m) | Length (m) | True Thickness (m) | Fe2O3 % | TiO2 % | V2O5 % |
|---|---|---|---|---|---|---|---|---|
| 1 | R-0009 | 94.0 | 181.2 | 87.2 | 84.4 | 50.67 | 10.15 | 0.339 |
| 2 | R-0008 | 170.0 | 237.6 | 68.3 | 66.2 | 46.15 | 9.21 | 0.311 |
| 3 | R-0046 | 20.0 | 74.0 | 54.0 | 43.7 | 58.33 | 8.78 | 0.415 |
| 4 | R-0040 | 84.9 | 130.0 | 45.1 | 31.9 | 51.20 | 7.94 | 0.340 |
| 5 | R-0010 | 1.5 | 137.0 | 135.5 | 121.7 | 50.03 | 7.87 | 0.352 |
| 6 | R-0039 | 97.0 | 149.1 | 52.1 | 50.4 | 58.15 | 7.68 | 0.459 |
| 7 | R-0051 ★NEW★ | 137.1 | 169.0 | 31.9 | 20.8 | 53.07 | 7.68 | 0.384 |
| 8 | R-0017 | 73.0 | 140.6 | 67.6 | 54.9 | 55.13 | 7.37 | 0.448 |
| 9 | R-0045 | 104.0 | 144.0 | 40.0 | 31.1 | 53.69 | 7.32 | 0.441 |
| 10 | R-0033 | 97.0 | 153.0 | 56.0 | 43.1 | 48.03 | 7.25 | 0.304 |
| 11 | R-0050 ★NEW★ | 116.0 | 169.0 | 53.0 | 42.9 | 49.61 | 7.24 | 0.401 |
| 12 | R-0052 ★NEW★ | 87.0 | 153.0 | 66.0 | 54.6 | 49.63 | 7.24 | 0.335 |
| 13 | R-0043 | 28.4 | 68.2 | 39.8 | 30.4 | 47.93 | 7.24 | 0.307 |
| 14 | R-0016 | 44.0 | 94.6 | 50.6 | 47.1 | 52.05 | 7.21 | 0.375 |
| 15 | R-0036 | 80.0 | 114.0 | 34.0 | 17.0 | 50.46 | 7.21 | 0.395 |
★NEW★ = Newly reported in this release. Highlighted rows show that R-0051, R-0050, and R-0052 rank #7, #11, and #12, respectively, out of the Top 15 best intercepts recorded to date at the Trapper Zone.
The Radar Property comprises 690 mineral claims across 9 mineral licenses, totalling approximately 24,175 hectares in southeastern Labrador, located approximately 10 km south of Cartwright. The Property entirely encloses the Dykes River Intrusive Complex (~160 km² at the surface) and is accessible year-round via paved Route 510, a Cartwright logging road, and a SAGA-constructed access trail. Infrastructure advantages include the deep-water port at Cartwright, the Cartwright Airport (YRF), and proximity to regional hydroelectric power from Muskrat Falls and Churchill Falls.
Diamond drilling, geophysics, trenching and geological mapping have confirmed a 29 km² oxide corridor encompassing the Trapper, Falcon and Hawkeye Zones. VTM mineralization at Radar is comparable to that of global Fe-Ti-V systems such as Panzhihua (China) and Bushveld (South Africa). Subject to further exploration, resource definition, and metallurgical testing, the Project may represent a strategic source of titanium, vanadium, and iron for North American markets.
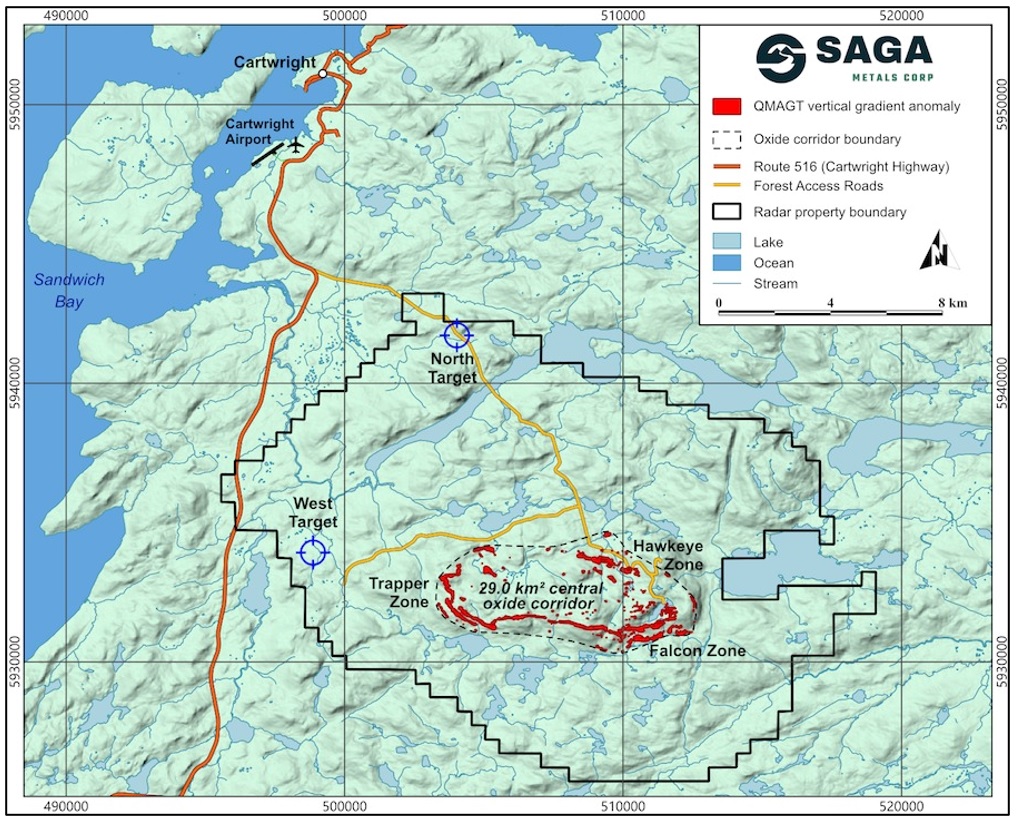
Figure 7: The Radar Property with the Dias QMAGT vertical gradient (Bzz) anomaly footprint shown in red (high-amplitude pixels only). The QMAGT-imaged central oxide-layering corridor validated over a 29 km² area, encompassing the Trapper Zone, Hawkeye Zone, and the new Falcon Zone, with additional targets highlighted to the west and north. The Property is well serviced by road access and is conveniently located near the town of Cartwright, Labrador.
Tap image to view full sizeDr. A. Miller, P. Geo., is an Independent Qualified Person as defined under National Instrument 43-101 and has reviewed and approved the technical information disclosed in this news release.
Diamond drill core was logged and sampled by Company personnel at SAGA’s core facility in Cartwright, Labrador. The drill core diameter was NQ. The core was cut lengthwise using a diamond saw, and one half was retained in the core box, while the other half was sampled at designated intervals for analysis.
Core samples were prepared and analyzed at the Impact Global Solutions (IGS) laboratory facility in Montréal, Québec. As part of the analytical quality assurance and quality control (QA/QC) program, certified reference standards, blanks, and duplicate samples were inserted into the sample stream at regular intervals to monitor analytical accuracy and precision.
Crush rejects and pulp samples are retained and stored in a secure facility for potential future verification and re-analysis. The Company maintains a rigorous QA/QC protocol consistent with industry standard practices.
SAGA Metals Corp. is a North American mining company focused on the exploration and discovery of a diversified suite of critical minerals that support the North American transition to supply security. The 100% owned Radar Ti-V-Fe Project comprises 24,175 hectares and entirely encloses the Dykes River intrusive complex, mapped at 160 km² on the surface near Cartwright, Labrador. Exploration to date, including 19,657 m of drilling, has confirmed a large, mineralized layered mafic intrusion hosting vanadiferous titanomagnetite (VTM) and ilmenite mineralization with strong grades of titanium and vanadium.
The 100% owned Wolverine Heavy Rare Earth Element Project in Labrador is a near-surface REE system hosted within a peralkaline caldera complex that shares strong geological similarities with the Tanbreez and Strange Lake deposits. The project features consistent mineralization, with zones spanning 26 km², including drill assays up to 2.03% TREO with approximately 28% HREO content, and sample assays up to 21.6% TREO.
The 100% owned Double Mer Uranium Project covers 25,600 hectares and features uranium radiometrics that highlight an 18 km east-west trend, with a confirmed 14 km section producing samples as high as 0.428% U3O8 (2024 Double Mer Technical Report).
Additionally, SAGA owns the Legacy Lithium Project in Quebec’s Eeyou Istchee James Bay region. This project spans 72,701 hectares and has geological attributes similar to nearby terrains currently being explored by Rio Tinto, Li-FT Power, SOQUEM, and Loyal Metals.
With a portfolio spanning key commodities critical to the clean energy future, SAGA is strategically positioned to play an essential role in securing critical minerals.
On Behalf of the Board of Directors
Mike Stier, Chief Executive Officer
For more information, contact:
Rob Guzman, Investor Relations
SAGA Metals Corp.
Tel: +1 (844) 724-2638
Email: rob@sagametals.com
www.sagametals.com
Neither the TSX Venture Exchange nor its Regulation Service Provider (as that term is defined in the policies of the TSX Venture Exchange) accepts responsibility for the adequacy or accuracy of this release.
Cautionary Disclaimer: This news release contains forward-looking statements within the meaning of applicable securities laws that are not historical facts. Forward-looking statements are often identified by terms such as “will”, “may”, “should”, “anticipates”, “expects”, “believes”, and similar expressions or the negative of these words or other comparable terminology. All statements other than statements of historical fact, included in this release are forward-looking statements that involve risks and uncertainties. In particular, this news release contains forward-looking information pertaining to the Company’s Radar Project. There can be no assurance that such statements will prove to be accurate, and actual results and future events could differ materially from those anticipated in such statements. Important factors that could cause actual results to differ materially from the Company’s expectations include, but are not limited to, changes in the state of equity and debt markets, fluctuations in commodity prices, delays in obtaining required regulatory or governmental approvals, environmental risks, limitations on insurance coverage, inherent risks and uncertainties involved in the mineral exploration and development industry, particularly given the early-stage nature of the Company’s assets, and the risks detailed in the Company’s continuous disclosure filings with securities regulations from time to time, available under its SEDAR+ profile at www.sedarplus.ca. The reader is cautioned that assumptions used in the preparation of any forward-looking information may prove to be incorrect. Events or circumstances may cause actual results to differ materially from those predicted, as a result of numerous known and unknown risks, uncertainties, and other factors, many of which are beyond the control of the Company. The reader is cautioned not to place undue reliance on any forward-looking information. Such information, although considered reasonable by management at the time of preparation, may prove to be incorrect and actual results may differ materially from those anticipated. This cautionary statement expressly qualifies forward-looking statements contained in this news release. The forward-looking statements contained in this news release are made as of the date of this news release, and the Company will update or revise publicly any of the included forward-looking statements only as expressly required by applicable law.
Source: Saga Metals Corp.
Past performance is not an indicator of future returns. NIA is not an investment advisor and does not provide investment advice. Always do your own research and make your own investment decisions. NIA has received compensation from SAGA of US$100,000 cash for a twelve-month marketing contract. This message is for informational and educational purposes only and does not provide investment advice.