$396 Billion Into Stocks… $4 Billion Into Gold & Silver
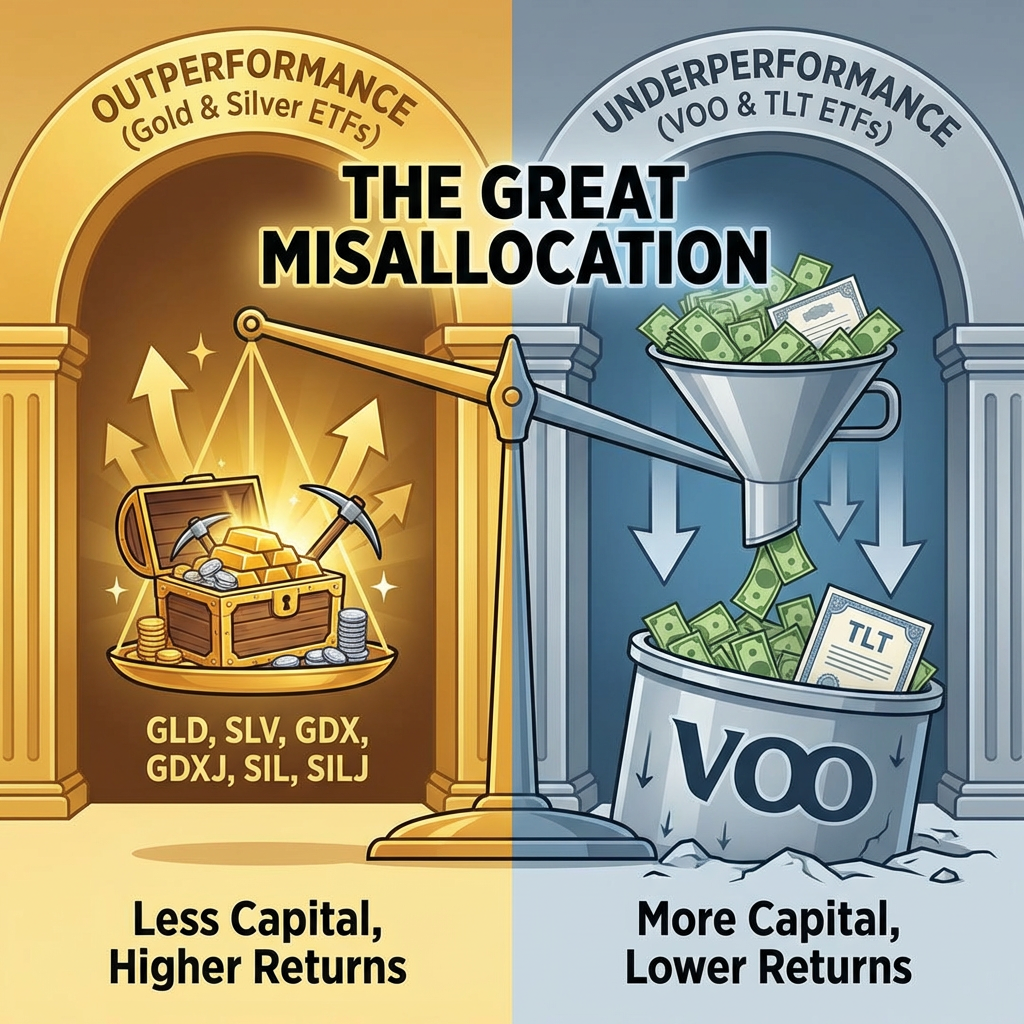
Over the past decade, investor capital has flowed in the exact opposite direction of performance.
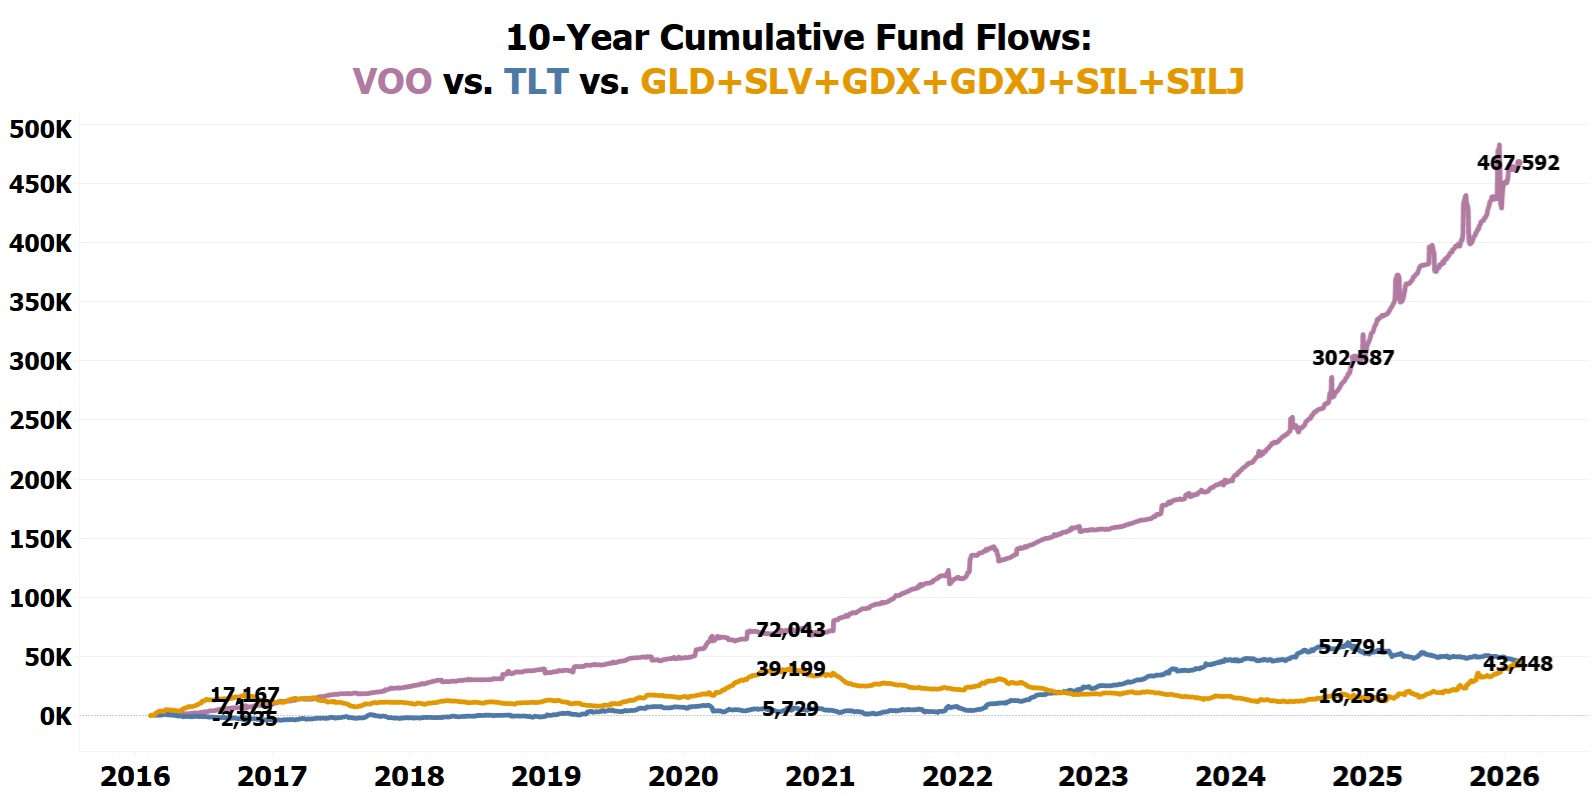
Cumulative fund flows into the Vanguard S&P 500 ETF (VOO) have reached $467.592 billion… 10.76× more than the combined flows into GLD + SLV + GDX + GDXJ + SIL + SILJ, which together total just $43.448 billion.
This would be understandable if VOO had been the best-performing asset. It wasn’t.
Every single one of these gold and silver ETFs has outperformed VOO over the same 10-year period.
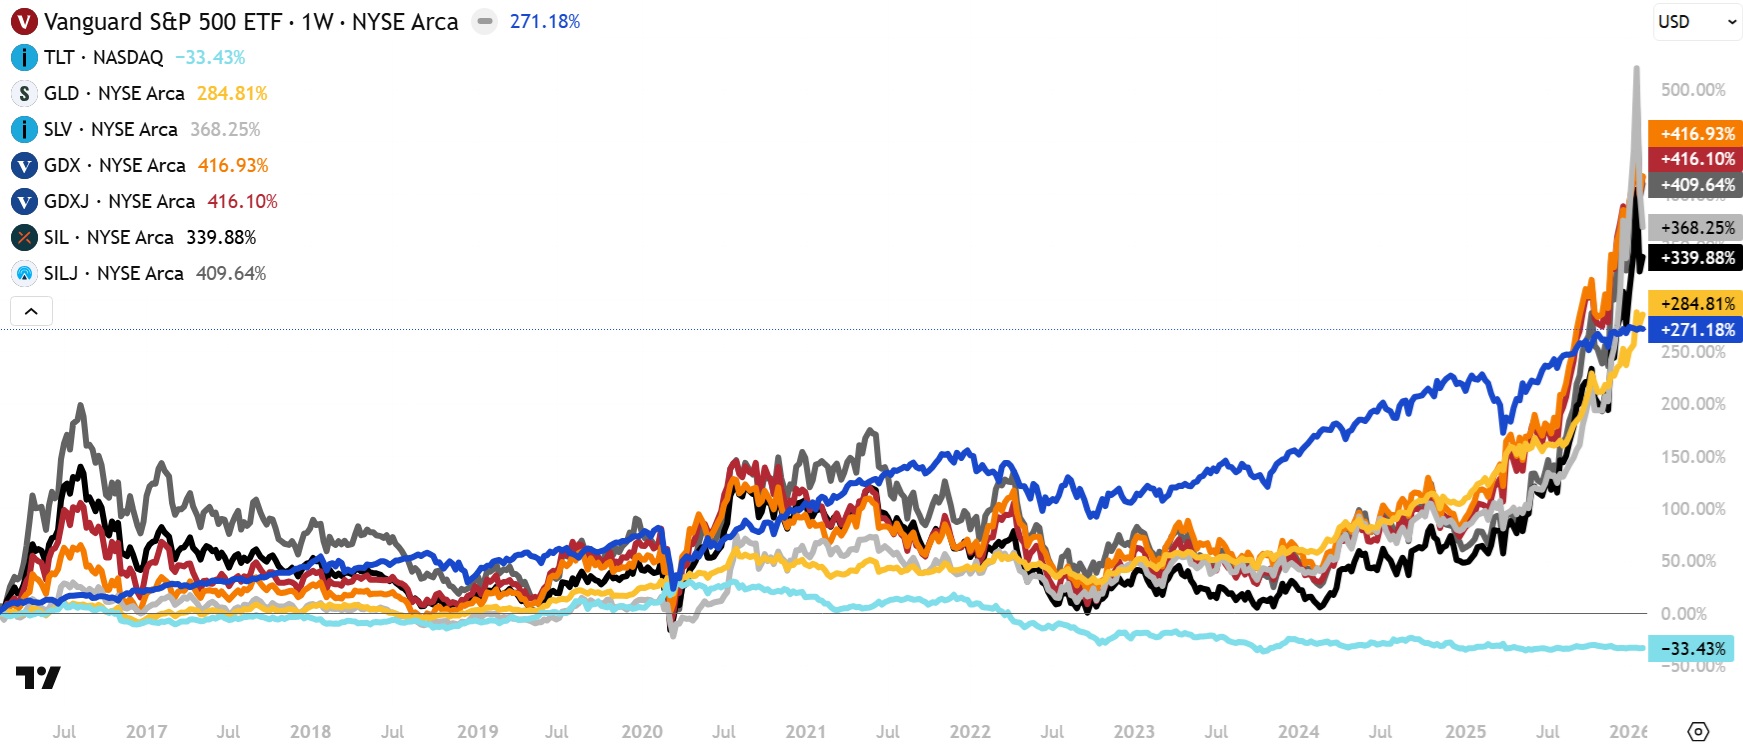
10-year total return comparison showing gold and silver ETFs outperforming both stocks and long-duration bonds.
The misallocation becomes even more extreme when bonds are included.
Over the past decade, cumulative inflows into the iShares 20+ Year Treasury Bond ETF (TLT) totaled $46.535 billion, exceeding the combined flows into all major gold and silver ETFs. Yet TLT has been the worst-performing asset of all, collapsing -33.43% during this period.
Despite underperformance, VOO and TLT absorbed nearly all investor capital over the past decade.
And even after TLT’s historic collapse, the allocation picture has barely changed.
Since October 14, 2020, cumulative fund flows show:
- VOO: +$395.55 billion
- TLT: +$40.806 billion
- GLD + SLV + GDX + GDXJ + SIL + SILJ (combined): +$4.249 billion
Despite years of clear outperformance by gold and silver, investors have allocated nearly 100× more capital to VOO than to the entire gold and silver ETF complex… and nearly 10× more capital to TLT, the worst-performing asset of all.
The average investor still has virtually zero exposure to gold and silver.