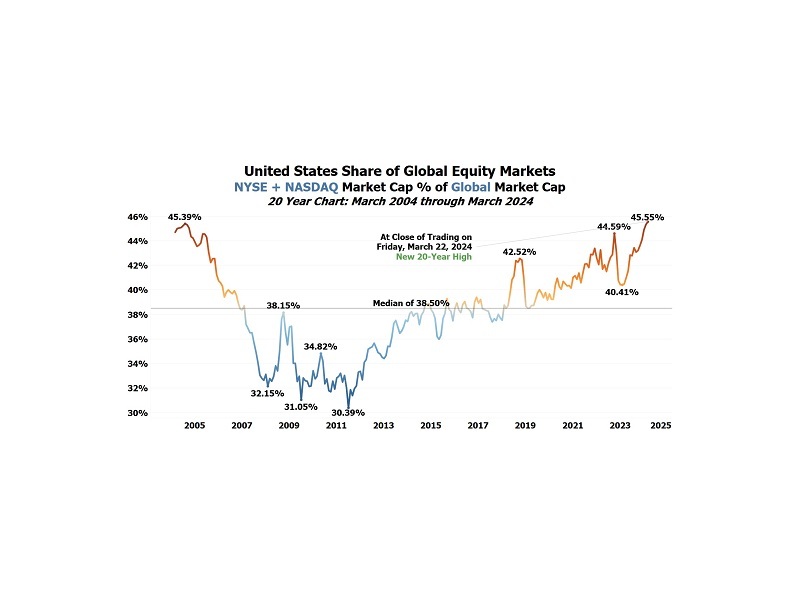
U.S. Share of Global Market Cap at New 20-Year High
This was a time-consuming chart for us to make because we had to compile the market cap data for literally all of the world’s stock exchanges and convert everything into U.S. dollars. No single source was fully complete or accurate, so we pieced together data from dozens of sources to produce reliable figures going back 20 years.
As of Friday’s close, the market cap of all U.S.-listed stocks on the NYSE and NASDAQ was $53.496 trillion, versus $63.937 trillion for the rest of the world, for a total global market cap of $117.433 trillion.
U.S.-listed stocks now represent 45.55% of the total global market cap — a new 20-year high. It is extremely unlikely this share can rise much further given that U.S. GDP is less than 25% of global GDP. A reversal lower appears imminent.
Over the past 20 years, the median market-cap share of U.S. stocks has been 38.50%.
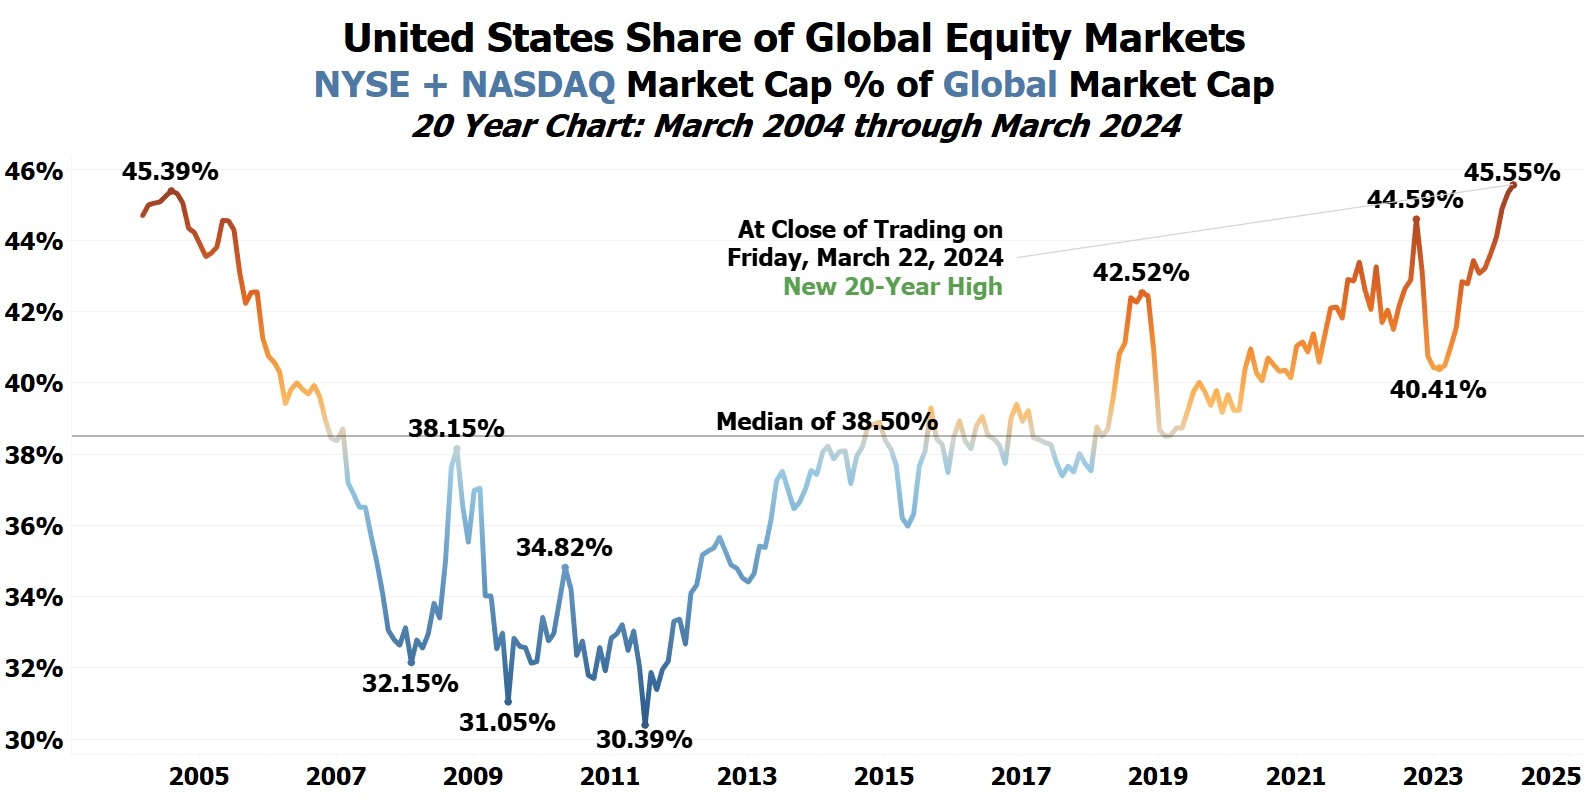
In July 2011, the U.S. market-cap share bottomed at 30.39%.
Before last week, the prior 20-year high was 45.39% in August 2004.
Between August 2004 and July 2011, as the U.S. share of global market cap declined from 45.39% to 30.39%:
Silver +490.76%
iShares MSCI Brazil ETF (EWZ) +314.63%
Gold +295.54%
Copper +249.21%
iShares MSCI Mexico ETF (EWW) +218.28%
HUI Gold Miners Index +162.12%
Energy Select Sector SPDR Fund (XLE) +139.28%
WTI Crude Oil +126.76%
The S&P 500 +17.03%
iShares 20+ Year Treasury Bond ETF (TLT) +11.56%
iShares MSCI Italy ETF (EWI) -22.41%
Financial Select Sector SPDR Fund (XLF) -48.77%
Past performance is not an indicator of future returns. NIA is not an investment advisor and does not provide investment advice. Always do your own research and make your own investment decisions. NIA’s President has purchased a position in EWZ. This message is for informational and educational purposes only.